Exploring the effects of timing and amount of tartaric acid additions on chemical, microbial and sensory characteristics of Cabernet Franc (Blenheim, 2021)
Kirsty Harmon
Blenheim Vineyards
Summary
Cabernet Franc is the most widely planted red grape variety in Virginia, performing well in the vineyard and achieving ripeness and grape quality that lead to distinctive wines. However, even with tartaric acid additions, these wines sometimes complete fermentation with pH values higher than desired for longer aging wines. The most common way to bring wine pH into acceptable ranges in Virginia is tartaric acid addition, and common wisdom holds that earlier acid addition leads to lower risk of microbial spoilage as well as better integration of acidity. In this study, the effects of a single, 2 g/L acid addition at crush were compared to an acid addition to the same target pH after the completion of malolactic fermentation. At the completion of alcoholic fermentation, wine that received no tartaric acid at harvest had very high pH (3.97/3.96) while the wine that received a 2 g/L addition had a pH of 3.69/3.73. At the end of malolactic fermentation, these values were 3.95 and 3.69, respectively. An acid trial of the high pH wine showed that 0.86 g/L tartaric acid was needed to match the pH of the other wine. After acid addition and aging, the two wines had comparable pH, potassium, tartaric acid, titratable acidity, and color. Wine that went through fermentation with lower pH had slightly lower volatile acidity throughout aging, however volatile acidity for both treatments was within acceptable ranges with both barrels showing relatively low microbial load. There was no significant difference in sensory characteristics in a triangle test comparing wine with early tartaric acid addition vs. later addition. Respondents that were able to distinguish the wines scored the early addition wine as having more bright/fresh/red character while the wine receiving later addition had more dark/dried/black character.
Introduction
Cabernet Franc and Petit Verdot are the two most widely planted red grape varieties in Virginia1. Both are bottled as a varietal wines and also used frequently in long aging Meritage blends. Despite having characteristics that make these good varieties to grow in Virginia vineyards2, both varieties have the potential to produce wines with high pH. In a survey of wines produced for WRE experiments from 2014 – 2020, the average pH for finished Petit Verdot wines was 3.85 and the average for Cabernet Franc was 3.76. Since these were finished, production scale wines, most of the wines included in this survey had been acidulated.
The likely cause of high pH in finished wines from these varieties is excess potassium in the grapes. Potassium in grapes is a function of soil, cultivar, vintage, rootstock, and farming techniques3. Though some interventions in the vineyard can reduce potassium, some variety/soil combinations will inevitably lead to high potassium juice with the potential to produce high pH wines.
When making red wine from fruit prone to high pH, the most commonly recommended approach is to add tartaric acid, however the magnitude and timing of additions can impact the resulting chemical and sensory characters of the wine. Both AWRI4 and Penn State Extension5 have publications advocating the addition of up to 4 g/L tartaric acid before fermentation in must that is known to have high potassium or comes from sites prone to high pH wines. Early addition allows for better retention of color and prevention of microbial spoilage common to high pH wines. However, lacking guidelines to determine how much acid to add, larger additions come with the risk of overly acidulation.
It is difficult to know at the beginning of fermentation how much acid is needed to achieve a final target pH. In a 2020 WRE study, Blenheim vineyards tested the effects of a large (4 g/L) tartaric acid addition to Petit Verdot from a vineyard known to produce high pH wines in the past. The acidulated wine completed malolactic fermentation with an average pH of 3.64 compared to 4.1 in the untreated wine. The acidulated wine had lower volatile acidity but also lower color. These wines were different in a triangle test. The acidulated wine had significantly higher scores for acidity and significantly lower scores for volume/body. Comments from winemakers indicated that the acidulated wine had been overly acidulated.
Several authors8,9 have developed equations for the prediction of final pH given various juice components, however these equations require measurement of juice components that are beyond the reach of most small to medium sized wineries and most predictions are only approximate. Gardiner5 recommends testing potassium to determine the amount of tartaric acid is needed, however no clear guidelines are given for tartaric additions based on potassium levels. The other approach is to add a smaller amount of tartaric acid initially, then more later. However, when pH<3.6, bitartrate precipitation has the effect of increasing wine pH, further exacerbating the issue.
Several WRE studies in 2021 examined the relationships among juice potassium, tartaric acid addition, wine pH and sensory characteristics. In this study, a single harvest lot of Cabernet Franc grapes was split into two treatments. At processing, a juice sample was taken for the determination of potassium. Treatment 1 received no acid addition at processing. Based on the potassium level of the must, Treatment 2 received 2 g/L tartaric acid addition. At the completion of malolactic fermentation, an acid trial was used to determine the amount of tartaric acid needed to bring Treatment 1 to the same pH as Treatment 2. Both wines were analyzed for chemical and sensory characteristics.
Methods
Cabernet Franc grapes from the Seaview Vineyard (Blenheim) were hand harvested on 9/7 and chilled overnight then destemmed but not crushed into TBins with the addition of 50 mg/L SO2 (as a KMBS addition) on 9/8. One day later (9/9), just prior to inoculation, juice samples were taken for general analysis (Brix, pH, TA) as well as an acid trial. To determine the malic acid, tartaric acid, and potassium of the juice, samples were shipped to ETS (St. Helena California). To prevent fermentation during transit, samples were loaded into sample tubes then weighed on a lab scale. To inactivate microbes, the tubes containing juice were briefly heated to boiling in the microwave, then weighed again. Any weight lost during boiling was replaced with distilled water to maintain the initial concentration of juice components.
Must was inoculated with 15 g/hL EC1118 yeast on 9/9. On the same day, 2 g/L tartaric acid was added to treatment bins only. Fermentations were monitored for °Brix and temperature each day following cap management. Bins were punched down twice daily throughout the fermentation until Brix measured lower than -1.5°. Once negative Brix had been reached (on 9/22), wine was drained from the bins without pressing. Wine was allowed to settle before transfer to comparable barrels and inoculation with Scott Labs MBR process (0.01 g/L). Malic acid tested 0.05 g/L or less by enzymatic analysis on 10/18. And acid trial was done at this time to determine the amount of tartaric acid addition to be made to the control to obtain the same pH as the treated wine. SO2 (100 mg/L) was added two weeks later (on 11/3). Tartaric acid (0.86 g/L) was added to the control barrel on 12/2.
Sensory analysis was completed by a panel of 17 wine producers. Wines were presented blind in randomly numbered glasses. Tasters were presented with three wines, two of one type and one of another, and asked to identify which wine was different (a triangle test). There were four tasting groups with the unique wine in the triangle test balanced between groups. Tasters were then asked to score each wine on a scale of 0 to 10 for fruit intensity, fruit character, acidity, astringency, and body/volume. They were also given open ended questions to describe the wines. Results for the triangle test were analyzed using a one-tailed Z test. Descriptive scores were analyzed using repeated measures ANOVA.
Results
Starting chemistry prior to any tartaric acid addition was very similar between the treatments (Table 1), though juice from the Treatment 1 bin (no acid addition at crush) had slightly lower pH and higher Brix than juice from the Treatment 2 bin. Treatment 2 received 2 g/L tartaric acid after the juice sample was taken.
At the completion of alcoholic fermentation, T1 had very high pH (3.97/3.96) while the pH for T2 was 3.69/3.73 (Table 2). Though 2 g/L of tartaric acid had been added to T2, the difference in tartaric acid between treatments was only 0.3 g/L at the completion of fermentation. This corresponded to a 300 mg/L (0.3 g/L) difference in potassium.
At the completion of malolactic fermentation, chemical parameters unrelated to acidity (% alcohol, SO2, etc…) were very similar (Table 3). pH and potassium values remained higher in the T1 wine than in the T2 wine while TA and tartaric acid were only slightly different (Table 4). Wine that received acid at crush had 0.1 g/L lower volatile acidity at the end of fermentation.
After wine had been treated with SO2 post-malolactic fermentation, an acid trial was conducted to determine how much acid to add to T1 to attain a similar pH target as T2 (Table 5). To account for anticipated precipitation of tartaric acid, two candidate addition rates were further tested by incubating 350 mL for one week, then measuring pH, TA, and potassium rates (Figure 1). The lower addition rate (0.86 g/L) was used for T1.
To determine changes in wine chemistry through aging, samples were taken in January and April (Table 6, Figure 2). Any time tartaric acid was added, potassium levels decreased, regardless of timing. However, addition of 2 g/L at crush resulted in less potassium loss than addition of 0.86 g/L post-malolactic fermentation. Potassium loss with post-ML addition was considerably more than predicted by benchtop trials, with the wine receiving post-malolactic addition measuring 1171 mg/L total vs. a predicted level of 1404 mg/L. Precipitation of potassium bitartrate first requires seed crystals to form, then crystals must grow large enough to no longer be soluble. This process takes time and continues during aging as long potassium bitartrate is present beyond its saturation level.
Despite differences in pH during fermentation, there was no difference in color intensity between the two wines after pH correction (Figure 3).
Wine that went through fermentation with lower pH had slightly lower volatile acidity throughout aging (Table 6), however volatile acidity for both treatments was within acceptable ranges with both barrels showing relatively low microbial load (Table 7). At Blenheim, 100 ppm SO2 is added at the end of fermentation, and acid adjustment to the high pH lot was done early (prior to sampling in January). Consequently, wine ages with microbially inhibitory levels of SO2 (Tables 3 & 8).
In theory, one potassium cation should bond with one bitartrate anion to form potassium bitartrate. By this logic, there should be an equal amount of potassium and tartaric acid lost from the wines. However, when measured values are compared, far more tartaric acid is lost than potassium (Table 9). Juice potassium is probably not a full measure of the available potassium, as this cation continues to leach from skin cells as they burst during fermentation. Therefore, though initial juice potassium may be helpful in determining if a wine is a candidate for early tartaric acid addition, it cannot be used as an exact measure of tartaric acid precipitation or estimation of final pH.
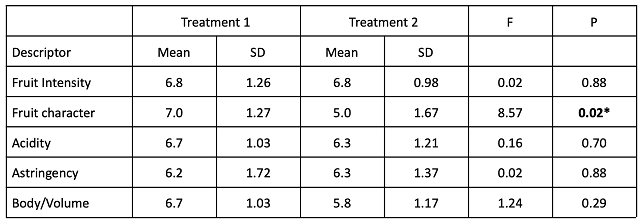
In a triangle test, 6 out of 17 respondents were able to distinguish which wine was different, indicating the wines were not significantly different (Z=-0.09, p= 0.5). Among respondents who could distinguish the wines, there were no significant differences in scores for fruit intensity, acidity, astringency or body/volume (Table 10). “Fruit character” was defined as “bright/fresh/red” (lower numbers) to “dark/dried/black”. Wine that received acid addition after malolactic fermentation received significantly higher scores for “fruit character” than the wine that received early addition.
Table 1: Juice analysis for Cabernet Franc (ETS labs)
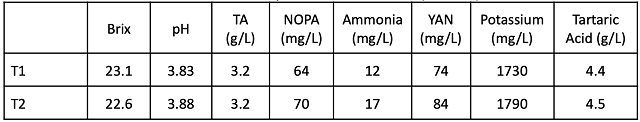
Table 2: Post-fermentation (pre-ML) wine analysis. Values reported are from ETS labs (Sept 23) unless otherwise noted.
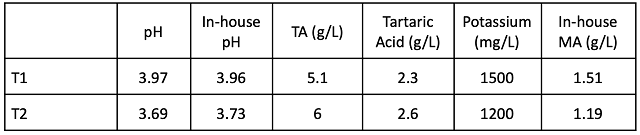
Table 3: General Chemistry post-ML (ICV labs, November 2021)
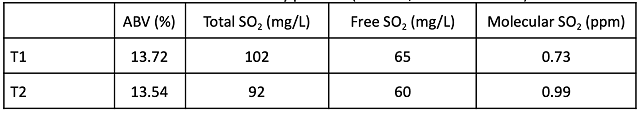
Table 4: Acid chemistry post-ML (ICV Labs, November 2021)
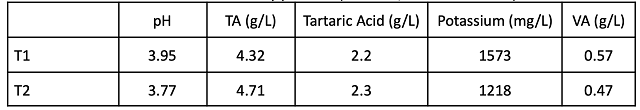
Table 5: Benchtop acid trial of control wine post-malolactic fermentation (in-house data, Nov)
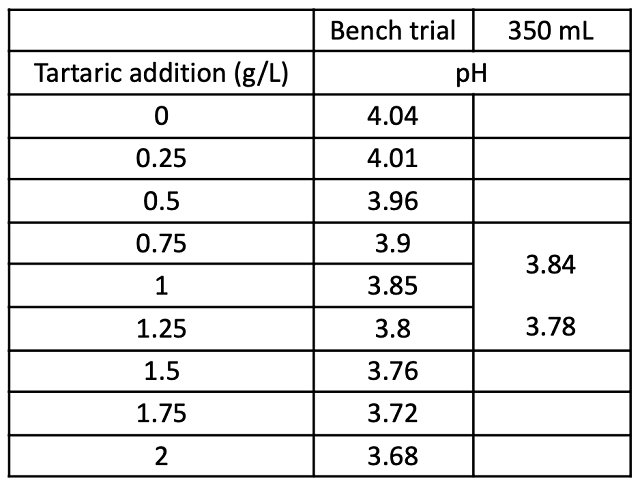
Figure 1: Acid chemistry of trial additions after 1 week of incubation (ICV Labs)
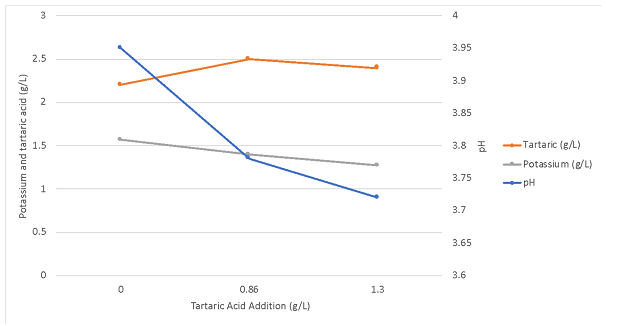
Table 6: Change in potassium, pH, volatile acidity and titratable acidity over time
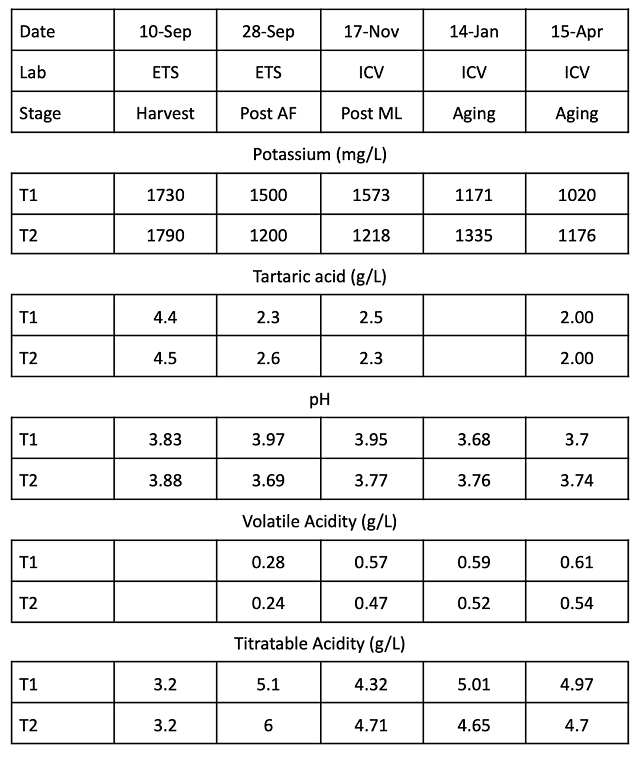
Figure 2: Change in potassium, pH and VA over time
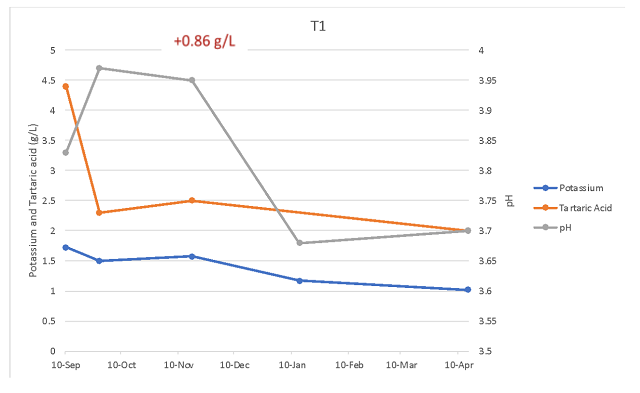
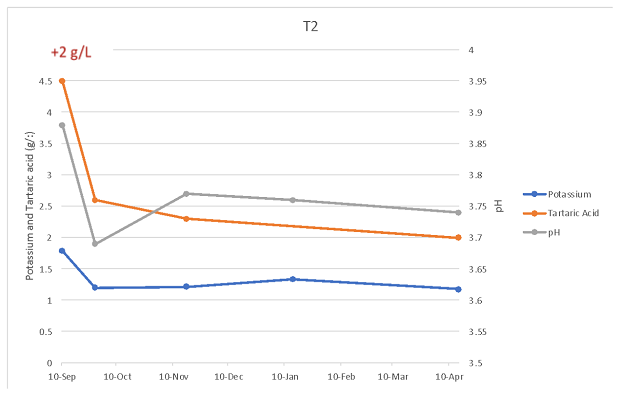
Figure 3: Color intensity for two treatments of Cabernet Franc (ICV Labs, April 2022). Values for intensity, hue, and free SO2 (ppm) are listed on the endcap of each column.
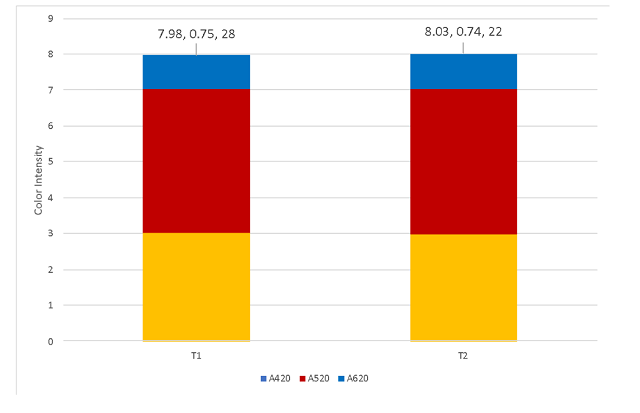
Table 7: Microbiology for two treatments of Cabernet Franc (ETS Labs, April)
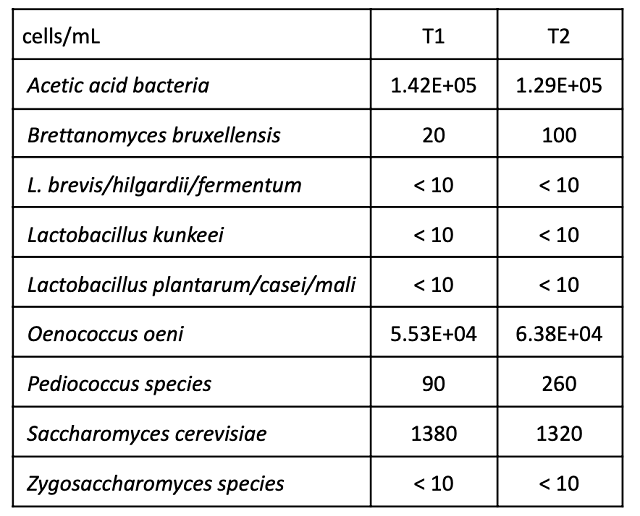
Table 8: Sulfur dioxide activity for two treatments of Cabernet Franc (in-house data)
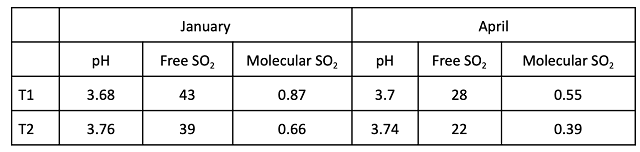
Table 9: Balance sheet for potassium and tartaric acid in two treatments of Cabernet Franc (g/L)
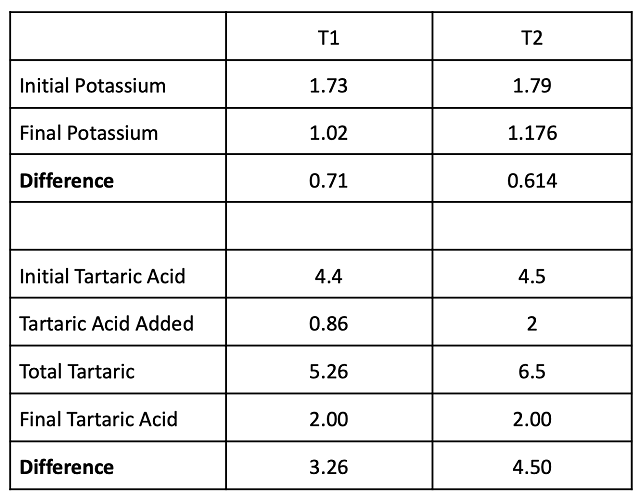
Table 10: Statistical analysis for descriptive scores from blind sensory analysis of Cabernet Franc
References
(1) 2021 Commercial Wine Grape Report; Virginia Wine Board, Virginia Vineyards Association, Virginia Wineries Association, 2022.
(2) Wolf, T. K. Wine Grape Production Guide for Eastern North America; Plant and Life Sciences Publishing: Ithaca, New York, 2008.
(3) Moss, R. Potassium in Viticulture and Enology. Virginia Cooperative Extension Viticulture Notes 2016.
(4) Ask the AWRI: Winemaking with High PH, High TA and High Potassium Fruit. Grapegrower and Winemaker 2018, October (657).
(5) Gardner, D. Making (red) wine from fruit high in potassium. Penn State Extension Wine & Grapes U. https://psuwineandgrapes.wordpress.com/2016/09/23/making-red-wine-from-fruit-high-in-potassium/.