Exploring the effect of timing and amount of tartaric acid addition on the chemical, microbial, and sensory characteristics of Petit Verdot (King Family, 2021)
Matthieu Finot
King Family Vineyards
Summary
Petit Verdot is the second most widely planted red grape variety in Virginia after Cabernet Franc, performing well in the vineyard and achieving ripeness and grape quality that lead to distinctive wines. Even with tartaric acid additions, these wines sometimes complete fermentation with pH values higher than desired for longer aging wines. The most common way to bring wine pH into acceptable ranges in Virginia is tartaric acid addition, and common wisdom holds that earlier acid addition leads to lower risk of microbial spoilage as well as better integration of acidity. However, in a survey of Petit Verdot wines from 2014-2020, the range of pH for finished Petit Verdot was 3.47 - 4.43, indicating that not all Petit Verdot grapes need aggressive tartaric acid addition. In this study, two different lots of Petit Verdot were monitored for acid and potassium chemistry throughout fermentation and aging. Control wines received no addition at crush while treatment wines received acid addition based on juice potassium. Post-ML acid addition was done in one lot while the control was left unacidulated. A large amount of tartaric acid was lost in all fermentations regardless of potassium levels, however more tartaric acid was lost in high potassium fermentations and fermentations to which tartaric acid was added. Tartaric acid addition increased the rate of potassium loss. In the high potassium lot (1058), early addition of tartaric acid had a smaller impact on pH shift than later addition. Later addition also led to higher titratable acidity. Wines with lower pH values completed fermentation and aging with lower volatile acidity, despite similar microbial load. Winemakers were not able to distinguish acidulated and unacidulated wines for the low potassium lot in a triangle test, however the acidulated wine received significantly higher scores for acidity and bright/fresh character among those who could distinguish the wine. Winemakers were able to distinguish the early acidulated wine from later acidulation in the high potassium lot, however there were no significant differences in descriptor ratings for these wines.
Introduction
Cabernet Franc and Petit Verdot are the two most widely planted red grape varieties in Virginia1. Both are bottled as a varietal wines and also used frequently in long aging Meritage blends. Despite having characteristics that make these good varieties to grow in Virginia vineyards2, both varieties have the potential to produce wines with high pH. In a survey of wines produced for WRE experiments from 2014 – 2020, the average pH for finished Petit Verdot wines was 3.85 and the average for Cabernet Franc was 3.76. Since these were finished, production scale wines, most of the wines included in this survey had been acidulated.
The likely cause of high pH in finished wines from these varieties is excess potassium in the grapes. Potassium in grapes is a function of soil, cultivar, vintage, rootstock, and farming techniques3. Though some interventions in the vineyard can reduce potassium, some variety/soil combinations will inevitably lead to high potassium juice with the potential to produce high pH wines.
When making red wine from fruit prone to high pH, the most commonly recommended approach is to add tartaric acid, however the magnitude and timing of additions can impact the resulting chemical and sensory characters of the wine. Both AWRI4 and Penn State Extension5 have publications advocating the addition of up to 4 g/L tartaric acid before fermentation in must that is known to have high potassium or comes from sites prone to high pH wines. Early addition allows for better retention of color and prevention of microbial spoilage common to high pH wines. However, lacking guidelines to determine how much acid to add, larger additions come with the risk of overly acidulation.
It is difficult to know at the beginning of fermentation how much acid is needed to achieve a final target pH. In a 2020 WRE study, Blenheim vineyards tested the effects of a large (4 g/L) tartaric acid addition to Petit Verdot from a vineyard known to produce high pH wines in the past. The acidulated wine completed malolactic fermentation with an average pH of 3.64 compared to 4.1 in the untreated wine. The acidulated wine had lower volatile acidity but also lower color. These wines were different in a triangle test. The acidulated wine had significantly higher scores for acidity and significantly lower scores for volume/body. Comments from winemakers indicated that the acidulated wine had been overly acidulated.
Several authors8,9 have developed equations for the prediction of final pH given various juice components, however these equations require measurement of juice components that are beyond the reach of most small to medium sized wineries and most predictions are only approximate. Gardiner5 recommends testing potassium to determine the amount of tartaric acid is needed, however no clear guidelines are given for tartaric additions based on potassium levels. The other approach is to add a smaller amount of tartaric acid initially, then more later. However, when pH<3.6, bitartrate precipitation has the effect of increasing wine pH, further exacerbating the issue.
Several WRE studies in 2021 examined the relationships among juice potassium, tartaric acid addition, wine pH and sensory characteristics. This experiment includes two separate lots of Petit Verdot, one that generally needs little acid addition (KFV R4) and one that generally needs aggressive acid addition (1058). Both blocks are located within the same larger vineyard, very close to one another. Soil analysis has shown that the KFV R4 block has very compacted soil, potentially leading to less available potassium.
-
For Lot 1058 fruit, there were two treatments. In the control lot, no acid as added at crush and 4 g/L tartaric acid was added post malolactic fermentation. The second (treatment) lot received 3 g/L tartaric acid at crush and 1 g/L tartaric acid addition post malolactic fermentation.
-
For Lot R4 (Randy’s Field), the control lot received no acid addition at crush. The second (treatment) lot received 1 g/L acid at crush.
Methods
Lot 1058
Fruit was hand harvested on 10/1, refrigerated overnight, then destemmed to TBins on 10/2. Must was inoculated with 0.15 g/L D254 yeast on 10/3. Must was chaptalized with 10 g/L sugar on 10/4. Tartaric acid (3 g/L) was added to the treatment bin only after fermentation had begun (on 10/6). Bins were pressed separately after the completion of fermentation, on 10/19, then transferred to two barrels per treatment, with comparable barrels in each treatment, on 10/20. Malolactic fermentation completed without inoculation, and each barrel received 66ppm SO2 and 0.03 g/L Stab Micro M on 11/3. After January analysis, an additional 1 g/L tartaric acid was added to barrels containing treatment wines while 4 g/L tartaric acid was added to the barrels containing control wines, such that both lots received the same overall amount of tartaric acid addition.
Lot R4
Fruit was hand harvested on 9/29, refrigerated overnight, then destemmed to TBins on 9/30 with the addition of 0.58 g/L ProTanin R and 30 ppm SO2. Must was inoculated on 10/1 with 0.15 g/L D254 yeast. Must was chaptalized with 15 g/L sugar on 10/4. Tartaric acid (1 g/L) was added to the Treatment bin only (not the control) on 10/6. Bins were pressed separately after the completion of fermentation, on 10/18, then transferred to two barrels per treatment, with comparable barrels in each treatment, on 10/29. Malolactic fermentation completed without inoculation, and each barrel received 66ppm SO2 and 0.03 g/L Stab Micro M on 11/3. There was no subsequent tartaric acid addition to either lot prior to sensory analysis.
Testing Juice potassium
To determine the malic acid, tartaric acid, and potassium of the juice, samples were shipped to ETS (St. Helena California). To prevent fermentation during transit, samples were loaded into sample tubes then weighed on a lab scale. To inactivate microbes, the tubes containing juice were briefly heated to boiling in the microwave, then weighed again. Any weight lost during boiling was replaced with distilled water to maintain the initial concentration of juice components.
Sensory Analysis
This experiment contained two flights for sensory analysis. For Flight 1, a panel of 18 wine producers compared wine from Lot 1058 that had been acidulated late (control) with wine that had been acidulated early (treatment). For flight 2, 17 wine producers compared non-acidulated (control) wine to acidulated wine from lot R4. For each flight, wines were presented blind in randomly numbered glasses. Tasters were presented with three wines, two of one type and one of another, and asked to identify which wine was different (a triangle test). There were four tasting groups with the unique wine in the triangle test balanced between groups. Tasters were then asked to score each wine on a scale of 0 to 10 for fruit intensity, fruit character, acidity, astringency, and body/volume. They were also given open ended questions to describe the wines. Results for the triangle test were analyzed using a one-tailed Z test. Descriptive scores were analyzed using repeated measures ANOVA.
Results
Must analysis conducted at the time of processing shows that fruit from Lot 1058 had high pH before fermentation even began, with relatively high levels of tartaric acid and potassium (Table 1). By contrast, must from Lot R4 had comparatively moderate pH and potassium levels.
Tartaric acid levels decreased notably for all treatments during fermentation (Table 2), however 1058 PV had a higher proportion of decrease than R4 PV (58/59% decrease vs. 37-48% decrease). For 1058 PV, the post-fermentation level of tartaric acid in the treatment was nearly the same as in the control, with only 0.2 g/L difference after a 3 g/L initial addition. For R4 PV, less tartaric acid was lost overall. After fermentation, 0.7 g/L of the initial 1.0 g/L addition was still measurable in the wine.
At the completion of fermentation, the control wine from Block 1058 fruit had much higher levels of potassium remaining while the difference in potassium between control and treated wine in the R4 was much smaller. In both lots, the treatment wine had lower pH and lower volatile acidity than the control wine. However, despite receiving 3 g/L tartaric acid at crush, treated wine from lot 1058 still ended fermentation with a pH of 3.96 while control fruit from the R4 fruit finished with a pH of 3.62, despite having no additional tartaric acid additions.
Three of the four lots had completed malolactic fermentation by the time of testing in late October, and the fourth lot was almost done. When determining acid additions post fermentation prior to malolactic fermentation, understanding the amount of malic acid remaining may affect acid addition decisions.
For the 1058 lot, potassium levels were analyzed for both free run and press fraction (Table 3). Despite common wisdom that press fraction wines will have higher potassium, and therefore higher pH, there is no difference in potassium between free run and press fraction in these wines. It is likely that potassium had been fully released from skin cells during fermentation.
Analysis of Lot 1058 in November indicated this lot finished malolactic fermentation with similar general chemistry between treatments (Table 4) but very different acid chemistry (Table 5). Despite very similar levels of tartaric acid in the wine, the control lot had higher pH, potassium, and volatile acidity, but lower titratable acidity. Lot KFV had not yet completed malolactic fermentation at this time, so was not included in the November analysis.
An acid trial was performed on lot 1058 at this time to determine the effect of a post-malolactic fermentation acid addition on pH and potassium of both control and treated wines (Figure 1, Table 6). To best replicate acid shifts that would occur in barrel, the acid trial was allowed to sit on the benchtop for 6 days. Large deposits of potassium bitartrate were seen in the bottom of acid trial flasks, accompanied with increases in pH from initial readings (Figure 1). After 6 days, wine was decanted off the potassium bitartrate sediment and sent to the service lab (ICV) for analysis. Despite large additions of tartaric acid (Figure 1), the measured amount of tartaric acid remained nearly the same in all treatments (Table 6, Figure 2). As expected, potassium decreased with increased amount of tartaric acid addition, indicting potassium bitartrate precipitation was still occurring (Table 6, Figure 2). At this stage, an addition of approximately 2.1 g/L tartaric acid would have been needed to bring the control wine to the same pH as the treatment wine. This addition would also lead to roughly similar amounts of potassium between wines. Though potassium continued to drop with more addition of tartaric acid, the magnitude of loss became less when less potassium was present.
R4 wine completed malolactic fermentation with lower pH values overall than wine from the 1058 block (Tables 4 & 7). The KFV control wine, with no added tartaric acid, completed malolactic fermentation with a pH of 3.72 while the wine treated with 1 g/L tartaric acid at crush completed with a pH of 3.55. These wines required no additional acidulation.
January analysis of wine from lot 1058 showed that, despite being finished with malolactic fermentation in November, the pH continued to rise (from 4.29 in November to an average of 4.42 in January)(Table 7). This might have been due to continued precipitation of potassium bitartrate, however the values for potassium also increased during this time period. It is unclear why that is the case.
Additional analysis was completed in April. The changes in potassium, tartaric acid, pH and volatile acidity can be seen in Tables 8 & 9, Figures 3 & 4.
A few trends emerge from this data:
-
In each of the wines, a large amount of tartaric acid was lost during alcoholic fermentation, regardless of whether there was an addition of tartaric acid. The proportion of tartaric acid lost was higher in the high potassium block (1058) with 58% tartaric acid reduction between juice and the completion of primary fermentation. In the KFV block, 48% of the tartaric acid was lost in the control lot while 37% of the tartaric acid was lost in the treatment block. The amount of potassium available affects the amount of tartaric acid lost.
-
Though the reduction in potassium and tartaric acid molecules should have a 1:1 correlation, the amount of tartaric acid precipitation and subsequent pH shift cannot be exactly predicted from the measured potassium level in juice alone (Table 10). This may be due to incomplete extraction of potassium in a juice sample. However, generally high amounts of potassium in juice do predict larger shifts in pH during fermentation.
-
Tartaric addition, whether at crush or after malolactic fermentation, resulted in lower potassium levels and lower pH values, with little change in tartaric acid. However, these also resulted in higher titratable acidity, which is the main contributor to the perception of acidity/sourness in wine.
-
Early tartaric acid addition in Lot 1058 (treatment) had less of an effect on pH than the same amount of addition after completion of malolactic fermentation (control). However, later addition led to a relatively higher titratable acidity, an indicator of sourness, when compared to early addition.
-
Lower pH values correlated with lower volatile acidity values in both lots. This effect was present as early as the end of fermentation. Many spoilage microbes are inhibited, at least in part, by the low pH environment of wine, leading to cleaner fermentation and aging. In addition, more free SO2 is in the antimicrobial molecular form at lower pH (Table 11), which should further inhibit spoilage. These differences were in activity, not overall differences in microbial load (Table 12).
In a triangle test of these wines, Flight 1 resulted in 11 out of 18 respondents able to distinguish which wine was different, indicating the wines were significantly different (Z=-2.25, p= 0.01). However, there were no significant differences in scores for fruit intensity, fruit character, acidity, astringency, or body/volume (Table 13) and open-ended comments did not show any trends.
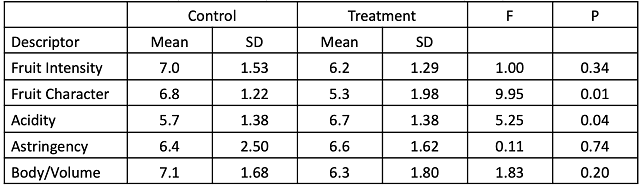
For Flight 2, 7 out of 17 respondents were able to distinguish the wines in a triangle test, indicating the wines were not significantly different (Z=-0.43, p= 0.34). Among those who could distinguish the wines, the treatment (acidulated) wine received significantly higher scores for acidity and lower scores for fruit character. “Fruit character” was defined as “bright/fresh/red” (lower numbers) to “dark/dried/black”, indicating that the non-acidulated wine presented with more dark fruit while wine receiving acid addition at crush had brighter fruit character. Brighter fruit character may correlate with higher acidity (Table 14).
Table 1: Juice chemistry for two lots of Petit Verdot (ETS labs)
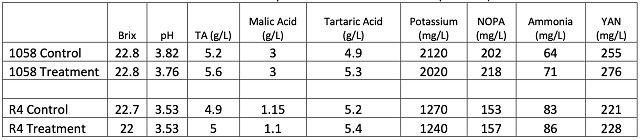
Table 2: Post fermentation analysis for two lots of Petit Verdot (ETS)
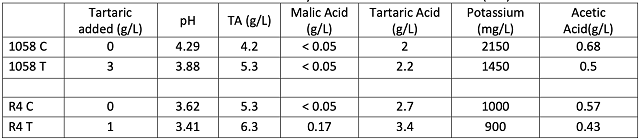
Table 3: Comparison of control and press fraction potassium for lot 1058 (ETS labs)
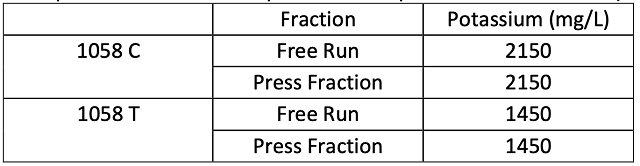
Table 4: General Chemistry post-ML for Lot 1058 (ICV labs, November 2021)
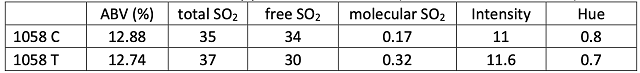
Table 5: Acid chemistry post-ML for Lot 1058 (ICV Labs, November 2021)
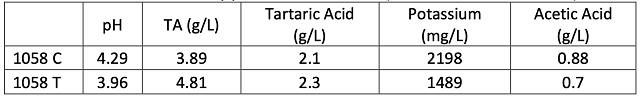
Figure 1: Acid trial for Block 1058 control wine post-malolactic fermentation. pH was measured at the time of addition (Nov 4) as well as one week later (Nov 10). Large tartaric acid deposits were visible at the bottom of the flasks containing the acid trials.
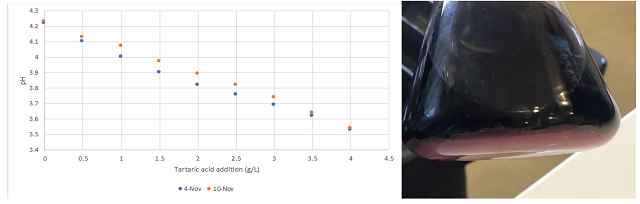
Table 6: Post- malolactic acid trial chemistry for Block 1058 post-malolactic fermentation
(ICV labs)
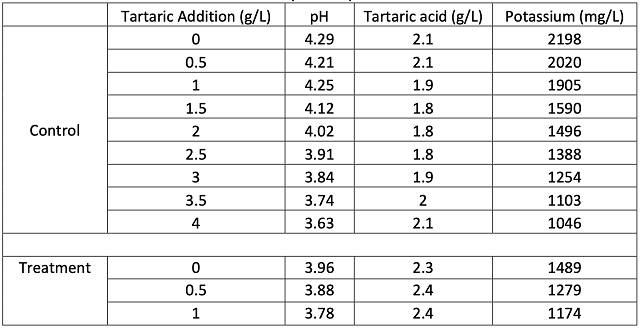
Figure 2: Comparison of changes in pH, potassium, and tartaric acid found in wine with tartaric acid addition, Lot 1058
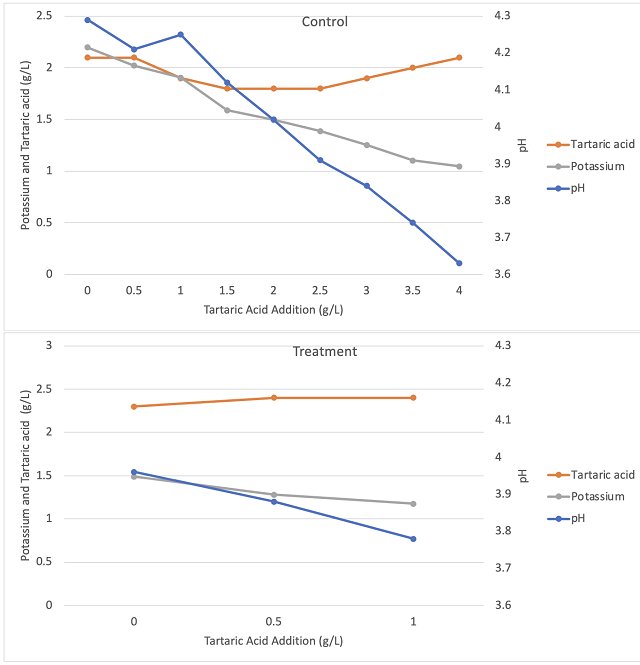
Table 7: General Chemistry post-ML for Lot R4 (ICV labs, January 2022)
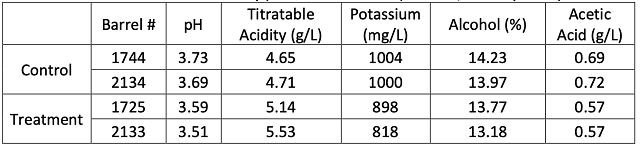
Table 8: Progression of Potassium, pH, and acetic acid over time in wine from Block 1058
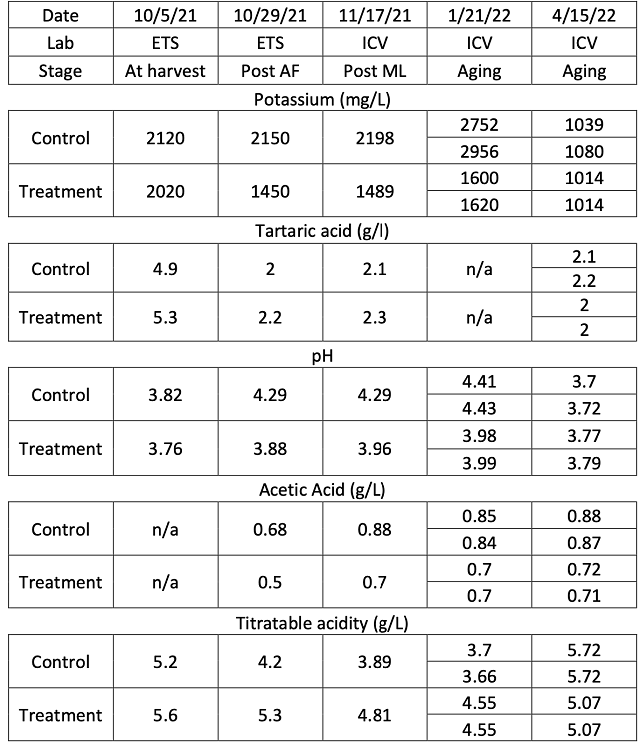
Table 9: Progression of Potassium, pH, and acetic acid over time in wine from Block R4
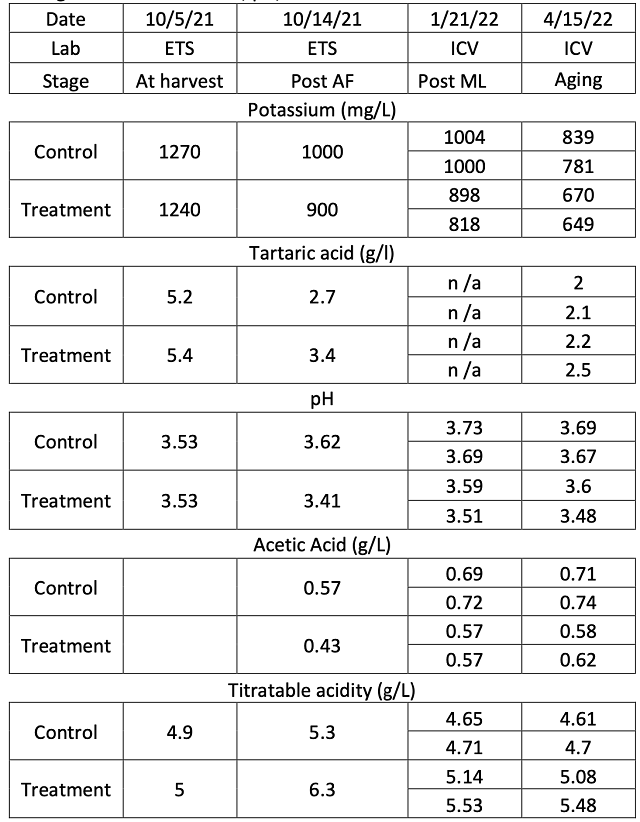
Figure 3: Progression of Potassium, tartaric acid, and pH over time in wine from Block 1058
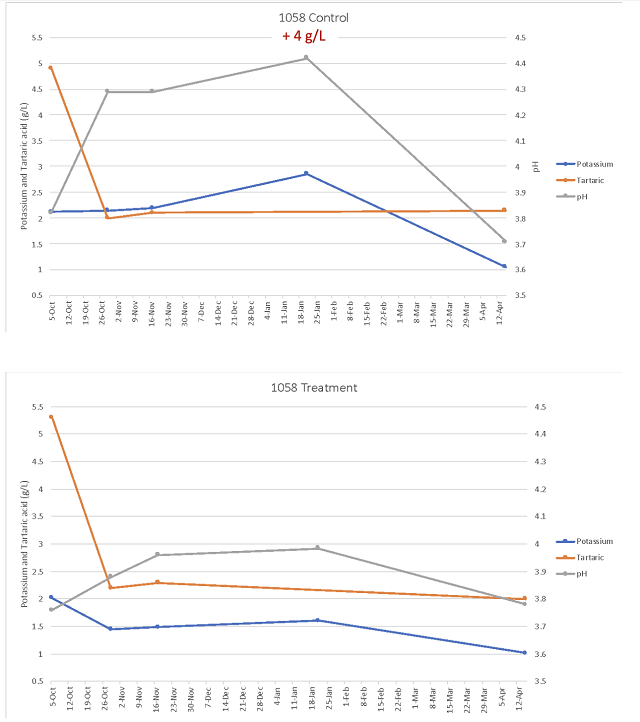
Figure 4: Progression of Potassium, tartaric acid, and pH over time in wine from Block R4
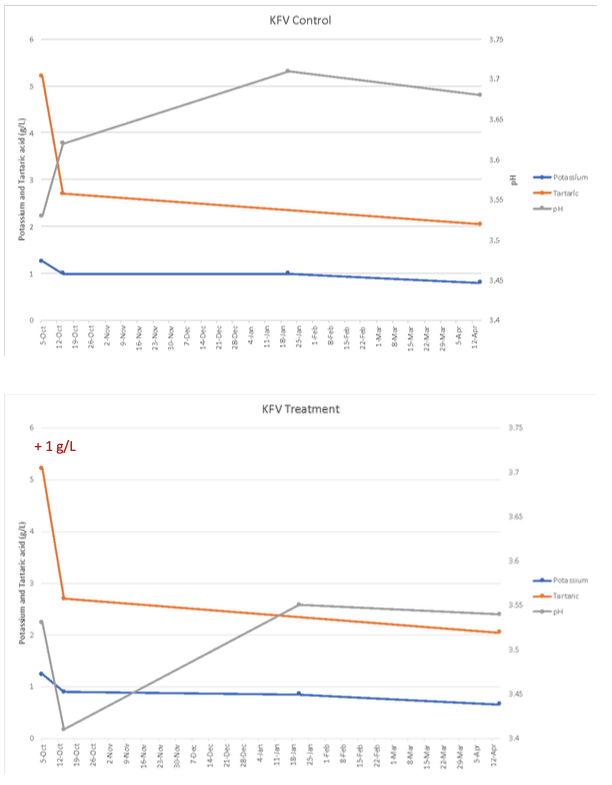
Table 10: Balance sheet for potassium (g/L) and tartaric acid (g/L) in two blocks of Petit Verdot
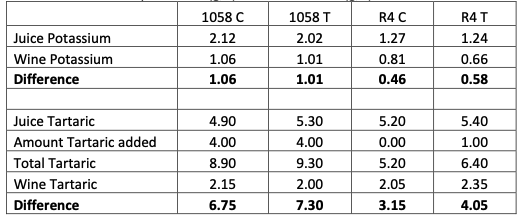
Table 11: Sulfur activity for two barrels of each treatment (ICV Jan 21)
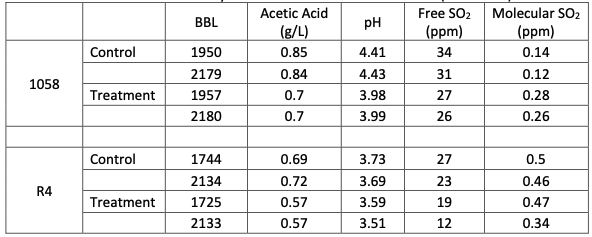
Table 12: Microbial analysis for two lots of Petit Verdot (ETS April 2022)
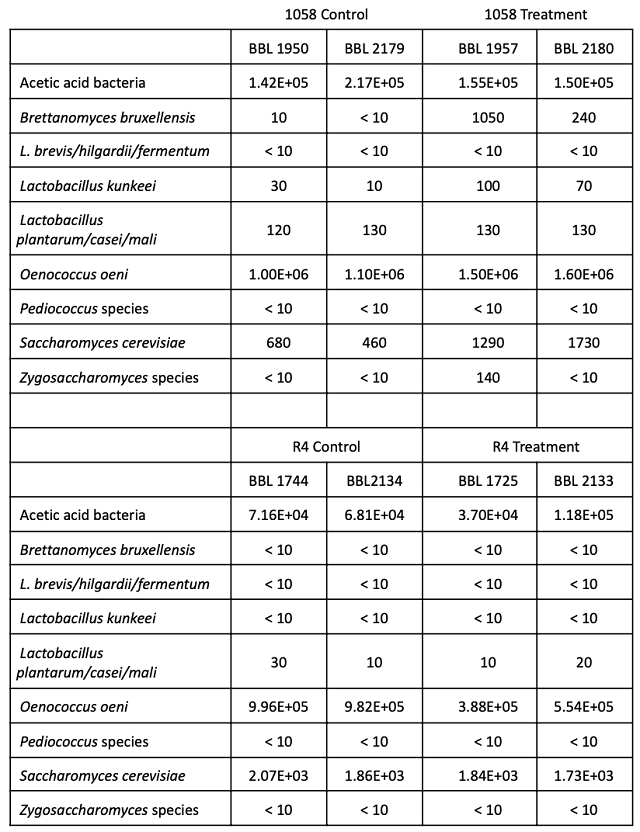
Table 13: Statistical analysis for descriptive scores from blind sensory analysis of Petit Verdot
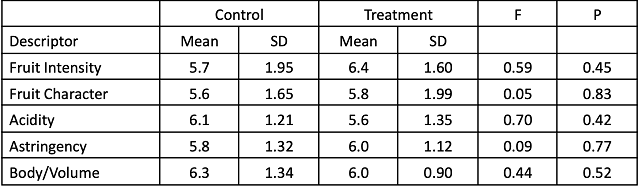
Table 14: Statistical analysis for descriptive scores from blind sensory analysis of Petit Verdot
References
(1) 2021 Commercial Wine Grape Report; Virginia Wine Board, Virginai Vineyards Association, Virginia Wineries Association, 2022.
(2) Wolf, T. K. Wine Grape Production Guide for Eastern North America; Plant and Life Sciences Publishing: Ithaca, New York, 2008.
(3) Moss, R. Potassium in Viticulture and Enology. Virginia Cooperative Extension Viticulture Notes 2016.
(4) Ask the AWRI: Winemaking with High PH, High TA and High Potassium Fruit. Grapegrower and Winemaker 2018, October (657).
(5) Gardner, D. Making (red) wine from fruit high in potassium. Penn State Extension Wine & Grapes U. https://psuwineandgrapes.wordpress.com/2016/09/23/making-red-wine-from-fruit-high-in-potassium/.
(6) Boulton, R. The General Relationship Between Potassium, Sodium, and PH in Grape Juice and Wine. American Journal of Enology and Viticulture 1980, 31 (2), 5.
(7) Boulton, R. The Relationships between Total Acidity, Titratable Acidity, and PH in Grape Tissue. Vitis 1980, 19, 113–120.
(8) Gómez, J.; Lasanta, C.; Palacios-Santander, J. M.; Cubillana-Aguilera, L. M. Chemical Modeling for PH Prediction of Acidified Musts with Gypsum and Tartaric Acid in Warm Regions. Food Chem 2015, 168, 218–224. https://doi.org/10.1016/j.foodchem.2014.07.058.