The Impact of Soil Conductivity on Petit Verdot Ripeness and Wine Quality in Ballerina Trellising (2017)
Submitted by Tim Jordan (in collaboration with Bubba Beasley)
Barren Ridge Vineyards
Summary
This study attempts to quantify the impact of soil conductivity on ballerina-trained Petit Verdot juice and wine chemistry, as well as on the sensory qualities of wine. Soil conductivity was determined by EM mapping performed by Bubba Beasley, in order to find areas of low and high conductivity within the vineyard block. The low conductivity soil had lower soil rock content (10%, channers), and the high conductivity soil had higher rock content (50%, shale). Then, fruit from each conductivity region was harvested on the same day but kept separate, and destemmed into two T Bins: One for low conductivity fruit, and the other for high conductivity fruit. Fermentations were punched down twice per day, and all other treatments between wines were identical. Average berry weight and cluster weight were slightly higher in the high conductivity treatments. Yield and viticultural parameters suggest an ESVC:CW of 1.7 and 1.9 for the low conductivity and high conductivity, respectively. Juice Brix and potassium was lower, and acidity and nitrogen were higher in the high conductivity treatment. These differences transferred through to wine chemistry. The high conductivity treatment seemed to have lower levels of phenolic compounds, and lower color. These results, overall, suggest that the lower conductivity wine had generally “riper” characteristics. These results would not be expected, as the higher conductivity soil (with higher rock content) would be expected to have less total available water in the soil for the grapevines to use. It would be more expected, therefore, that the high conductivity vine would have had less water, and thus potentially more “ripe” chemistry characteristics. Overall, these wines were not found to be significantly different in triangle testing. No preference trends could be seen. Additionally, descriptive analysis results were inconsistent between tastings, and no general trends can be seen except perhaps that the high conductivity wine had slightly lower Body. In the future, this study should be repeated over multiple vintages, on different grape varieties, and at different sites.
Introduction
Electromagnetic conductivity (EC) soil mapping is a measurement of electrical current that often times correlates with various soil characteristics that determine plant health. These characteristics can include drainage, salt composition, nutrient density, and soil character. High electrical conductivity correlates to high cation exchange capacity, and is often found in drier soils (due to less salt leaching) or clay soils. Higher conductivity soils also tend to have lower rock content. Soil conductivity, indirectly measuring ionic characteristics of the soil, may also give insight into pH characteristics of fruit grown in that soil. When conductivity mapping is used in vineyards, it may provide valuable information on vineyard management, and help the winemaker select the most productive and hearty vines.
The purpose of this study was to quantify differences of soil EC, rock content, and canopy design on Petit Verdot fruit and juice chemistry and sensory, physical and chemical properties of wines. The rock content and EC was determined by an EC mapping project conducted by Bubba Beasley. This study in particular looks at a ballerina trellising block and should be compared to its sister study performed on VSP trellising (where conductivity differences were less extreme).
Results and Discussion
High and low conductivity harvest zones were determined using EM mapping and laid out in the field using differential GPS technology. Soil variability is controlled by soil depth and the occurrence of shale (or lack thereof), based on observations of soil auger holes and backhoe test pits. Composite soil samples and harvest fruit samples were taken at pre-determined sample locations in each zone. Petiole data is not available for the ballerina block, as the study area was not added until after veraison. Large EC differences were found in the two soil types, and these differences were mirrored in soil cation content. Interestingly, the high EC soil also had a high rock content (50% shale), whereas the low EC soil had low rock content (10% channers). It must therefore be born in mind that the differences in the results may not only be due to electroconductivity differences, but also to differences in soil rock content
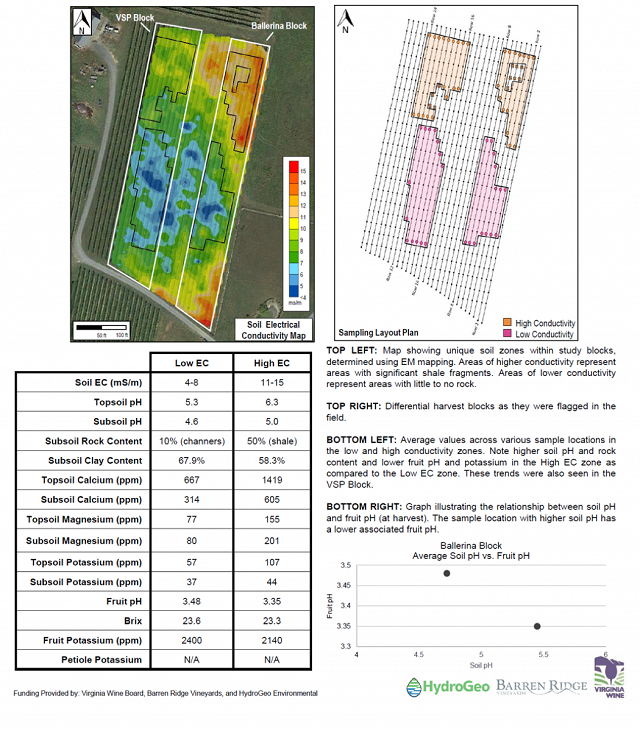
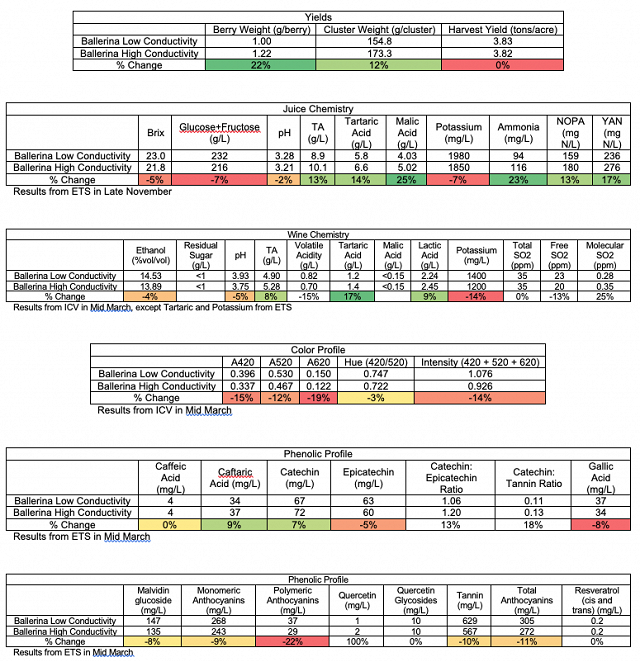
Average berry weight and cluster weight were slightly higher in the high conductivity treatments. Yield and viticultural parameters suggest an ESVC:CW of 1.7 and 1.9 for the low conductivity and high conductivity, respectively. Juice Brix and potassium was lower, and acidity and nitrogen were higher in the high conductivity treatment. These differences transferred through to wine chemistry. The high conductivity treatment seemed to have lower levels of phenolic compounds, and lower color. These results, overall, suggest that the lower conductivity wine had generally “riper” characteristics. These results would not be expected, as the higher conductivity soil (with higher rock content) would be expected to have less total available water in the soil for the grapevines to use. It would be more expected, therefore, that the high conductivity vine would have had less water, and thus potentially more “ripe” chemistry characteristics.
For the triangle test on April 4, of 10 people who answered, 5 people chose the correct wine (50%), suggesting that the wines were not significantly different. Of those who answered correctly, 3 preferred the low conductivity wine, and one had no preference. The high conductivity wine may have been perceivably lighter in color and may have had a more subtle nose. For the descriptive analysis, there were no strong trends for the descriptors used in this study. There may have been a slight tendency for the high conductivity wine to have lower Acidity, Bitterness, and Body.

For the triangle test on April 18, of 10 people who answered, 4 people chose the correct wine (40%), suggesting that the wines were not significantly different. There were no distinguishable preference trends between each treatment. For the descriptive analysis, there were no strong trends for the descriptors used in this study. The high conductivity wines may have had slightly higher Acidity, Bitterness, and slightly lower Body.

Overall, these wines were not found to be significantly different in triangle testing. No preference trends could be seen. Additionally, descriptive analysis results were inconsistent between tastings, and no general trends can be seen except perhaps that the high conductivity wine had slightly lower Body. In the future, this study should be repeated over multiple vintages, on different grape varieties, and at different sites.
Methods
Soil sampling and analysis was performed by Bubba Beasley (HydroGeo Environmental). Soil pH numbers are the weighted average of topsoil and two different subsoil samples, and fruit pH is the fruit harvest pH. Soil samples were taken adjacent to the vine on which fruit samples were taken. Fruit potassium represents harvest potassium (obtained by homogenizing grape samples).
During the growing season, LalVigne Mature was applied at 0.9 pounds/acre in two applications, once at 50% veraison on 8/21/17 and a second time 7 days later on 8/28/17. Approximately 0.75 tons/treatment of BR Petit Verdot were harvested into 25 pound lugs on 10/6/2017 and held overnight in a reefer truck at 40°F. The next day, on 10/7/17, the fruit was destemmed whole-berry into 2 T-bins in the following treatments:
- T-bin 1: 0.70 tons destemmed fruit, not crushed, from High conductivity
- T-bin 2: 0.70 tons destemmed fruit, not crushed, from Low conductivity
Each treatment received 4.5 g/hL sulfur dioxide during destemming layered at half full and on top of T-bin. Prior to inoculation, a juice panel was drawn for in-house analysis and WRE analysis. All treatments were inoculated with D254 at 20g/hL on 10/7/17 with 24 g/hL GoFerm during yeast rehydration. After inoculation, each T-bin was allowed 24 hours of rest before twice-daily punch down. When must temperature reached 65°F and lag phase complete, ColorPro was added at 20ml/hL and Superfood at 20g/hL on 10/10/17. Malolactic bacteria (Alpha, Lallemand) were inoculated in each T-bin on 10/13/17 near the end of primary fermentation (0 Brix). VR Color (Laffort) was added 10/13/17.
All treatments were pressed on 11/7/17 to ensure equal maceration time. Before pressing, a single, first-use barrel was filled with free run from each treatment T-bin. Kadar Heritage MT barrels were used. Tartaric acid was added to each treatment barrel on 12/4/17 at a rate of 1.2 g/L and stirred to mix. Malolactic fermentation was monitored until all lots were below approximately 0.05g/L malic acid. On 3/1/17, 4.4g/hL sulfur dioxide was added to each barrel using two Oenosteryl 5 Effervescent (Laffort) tablets. WRE samples were removed from barrel on 3/9/17.
These wines were tasted on April 4 and April 18. For the triangle test, descriptive analysis, and preference analysis for the April 4 tasting, anybody who did not answer the form were removed from consideration for both triangle, degree of difference, and preference. Additionally, anybody who answered the triangle test incorrectly were removed from consideration for degree of difference and preference. Additionally, any data points for preference which did not make sense (such as a person ranking a wine and its replicate at most and least preferred, when they correctly guessed the odd wine) were removed.
In order to balance the data set to perform statistical analysis for descriptive analysis on the April 4 tasting, any judge who had not fully completed the descriptive analysis ratings were removed. In order to then make the number of judges between groups equivalent, one judge from group 1 was eliminated. This resulted in a final data set of 3 groups, each with 3 judges (considered as replications within groups, and groups were considered as assessors). Data was analyzed using Panel Check V1.4.2. Because this is not a truly statistical set-up, any results which are found to be statistically significant (p<0.05) will be denoted as a “strong trend” or a “strong tendency,” as opposed to general trends or tendencies. The statistical significance here will ignore any other significant effects or interactions which may confound the results (such as a statistically significant interaction of Judge x Wine confounding a significant result from Wine alone). The descriptors used in this study were Fruit Intensity, Herbaceous/Green, Acidity, Bitterness, Astringency, and Body.
The same procedures for data analysis were used on the April 18 tasting. For the descriptive analysis in this tasting, one judge was eliminated from group three and one was transferred from group 2 to group 1 so that each group had two judges, for a total of 6 judges.