The Impact of Soil Conductivity on Petit Verdot Ripeness and Wine Quality (2018)
Tim Jordan, in collaboration with Bubba Beasley of HydroGeo
Barren Ridge Vineyard
Summary
Electrical conductivity measurement of vineyard soils can be used in conjunction with other vineyard mapping techniques for precision viticultural management and site selection. However, the impact of electrical conductivity of the soil on the quality of resulting wines is undetermined. In this study, Bubba Beasley of Hydro Geo used electrical conductivity along with soil pits to map two blocks of Petit Verdot at Barren Ridge Vineyards. In each block, regions of relatively high conductivity and relatively low conductivity were identified. Grapes from each region were harvested and vinified separately, and wines analyzed for chemical and sensory differences. Vines in high conductivity soils produced grapes with higher Brix and lower pH. The resulting wines showed lower pH and higher tannin content from high conductivity soils. There were no significant differences in sensory properties as determined by a triangle test. This is the second year of this study. Brix and tannins did not show the same trend in 2017, however, in both years, wines from high conductivity soils had lower pH.
Introduction
Electrical conductivity (EC) is a precision agriculture tool that has potential use in viticulture when applied to questions of site evaluation as well as management decisions within existing vineyards. Simply put, EC measures the ability of a material to transmit an electrical current1. EC data correlates well with Natural Resource Conservation Service (NRCS) maps, the gold standard in soil science, but has the advantage of finer scale mapping characteristics. While traditional grid soil sampling allows for 2.5 acre inclusions, standard electrical conductivity mapping allows for ¼ acre scale data. In addition, when NRCS maps were produced, GPS was not available, so lines can be 50-200 feet off. EC data is linked to GPS, allowing more accurate locating of transition zones2. NRCS maps give characteristics such as slope and crop suitability, so can be used together with EC to provide a potential tool for precision agriculture. These tools have been used for delineation of management zones by crop yield in other crops1, and in vineyards, can be used to determine suitability of a site for planting, to direct locations for digging soil pits, and to delineate areas within existing vineyards for differential management or fruit utilization. For example, a site with higher conductivity may require a different level of fertilization than a site with lower conductivity, as soil water holding capacity and cation exchange capacity will affect how nutrients are held in soil and exchanged with the plant.
Electrical conductivity is an indirect measurement that correlates with many soil properties affecting crop productivity in general and may affect wine quality specifically1,2. Measurements produced by EC can predict soil texture, which affects rooting depth. High EC values indicate clay soil. More importantly for vineyards, EC also correlates with cation exchange capacity and pH, which affect the availability and uptake of nutrients as well as drainage conditions and water holding capacity, which affect water availability and vegetative growth. High electrical conductivity measurements indicate high cation exchange capacity and high water holding capacity1.
The cation exchange capacity (CEC) is the capacity of a given soil to hold nutrients. Soil is made up of three fractions: solid particles, water-based soil solution surrounding those particles, and gasses dissolved in that solution. Nutrients are found adsorbed to soil particles, held by weak or strong chemical attraction, as well as dissolved in the soil solution. Vines can only access the nutrients that are dissolved in soil solution. Plant root uptake of nutrients from solution results in the release of additional nutrients from soil particles, maintaining an equilibrium in the soil solution. The CEC is a measure of the total number of binding sites for cations on soil particles3. Cation binding is also affected by soil pH. Basic soils between pH 6.5 and 7.0 are thought to be ideal for cation exchange3. Soils outside this range may hold cations too tightly for exchange, or too loosely, so that they are lost to leaching. In vineyards, as production goals focus on grape quality rather than vine vigor or maximum production, exchange is not always the driving concern. Instead, cation balance becomes more important 4. Not all cations bind to soil particles equally; Calcium and Magnesium bind more strongly than Potassium4, potentially leading to less potassium availability to plants due to leaching. Potassium is more available at lower pH and less available at higher pH, due to binding kinetics with soil particles3. Many Virginia soils have low pH and high availability of potassium. A general hypothesis would be that low EC soils would produce wines with lower potassium those made from high EC soils for soils of similar pH.
Water holding capacity of the soil is also important in vineyard site selection and management. In vineyard soils, water is needed to allow deep and spreading root growth and provide moisture to replace the water that is lost through transpiration. However, excess water (a more common problem in Virginia than dry soils) can lead to excessive vegetative growth that causes shading and disease, increased fruit acidity, diluted fruit and wine flavors, and split berries that lead to rot4. High EC values usually indicate large amounts of pores holding water in the soil, corresponding to clay particles. Taken together, one would predict low EC soils to hold less water, and thus produce vines with smaller berries, higher brix, lower acid, and more concentration of flavors.
The following study is part of a larger study by Bubba Beasley of Hyrdo Geo in partnership with Barren Ridge Vineyards and the Virginia Wine Board to explore the relationships among electrical conductivity of soils, soil properties, plant tissue nutrients, fruit chemistry and final wine chemistry. All electrical conductivity, soil and plant sampling work has been done by Bubba Beasley (Hydro Geo) and will be reported elsewhere.
This study examined two blocks of Petit Verdot vines at Barren Ridge Vineyards. Both are north/south facing rows which were planted 3 years apart. One block uses vertical shoot positioning while the other using a Ballerina (modified Smart Dyson) canopy system. Historically, the VSP block produces less canopy and lighter crops (2- 4 tons/acre). The Ballerina block produces more canopy and larger crops (4-7 tons/acre).
Measurement of soil conductivity by Bubba Beasley at Hydro Geo revealed areas of different conductivity within both Petit Verdot blocks: “low” conductivity and “high” conductivity. These areas were identified and flagged with tape for fruit sampling and differential harvesting. Boundaries for each block are shown in Figures 1 and 2.
Indirect methods such as EC should also be followed up with direct methods, such as digging pits, soil sampling, and testing of plants and fruit, as high or low EC could be caused by a number of factors2. Soil analysis from these blocks can be found in Figure 3. Characteristics of the lower conductivity soil include lower pH and lower cation concentrations (with the exception of potassium) (Figure 3). Initial studies indicate differences may be more pronounced in the ballerina block than the VSP block, however the VSP block had fewer data points in the initial studies.
Soil analysis also revealed that the high EC portions of this vineyard in both blocks also have high rock content. Whereas high conductivity is usually associated with higher amounts of clay in the soil, here there is less clay simply due to displacement with rocks (which themselves also have high conductivity), changing predictions for vine performance in high vs. low conductivity plots. In this special case, high EC parcels would be expected to have better drainage and lower nutrient content than low EC parcels.
The purpose of this portion of the study is to explore whether differences in soil conductivity correlate with differences in wine quality as well as determine if these two parcels (“high” and “low”) should be harvested separately in the future.
Methods
To determine if differences in soil conductivity affect fruit and wine quality, rows of high conductivity and low conductivity were identified within the blocks as separate lots (Figures 1 and 2). “East” blocks correspond to Ballerina canopy (modified Smart Dyson) and “west” blocks correspond to VSP canopy positioning. Cluster weight, berry weight, and the number of berries per cluster were determined two days prior to harvest by sampling one cluster per vine from 10 vines within each conductivity zone.
To allow functional winemaking units, 0.75 tons (60 lugs x 25 lbs) were picked for each treatment and fermented in TBins. There was one TBin per treatment. All other winemaking additions and procedures were identical between lots.
There were 4 treatments total:
- Low conductivity, Ballerina
- High conductivity, Ballerina
- Low conductivity, VSP
- High conductivity, VSP
Fruit was destemmed without crushing with addition of 10 g/ton SO2. No bleeds were done on the experimental lots. Fruit was refrigerated, then warmed and inoculated with 20 g/hL D254 rehydrated in 25 g/hL Go Ferm. Laffort 450 preAC was co-inoculated 48 hours after the beginning of alcoholic fermentation. No acid additions were made. Sugar additions were made to a common target of 22°Brix using a chaptalization conversions rate of 17 g/L addition for 1 degree ABV. Chaptalization occurred at 10°Brix. Fermentations were monitored daily from the time of destemming. T-bins were kept side by side in a temperature controlled refrigerated truck with ambient temperature near 75°F. All treatments received the same nutrient additions: Superfood at 15 g/hL at the end of lag phase and 15 g/hL at 1/3 sugar depletion. Both treatments were drained and pressed the same day. Wine was racked to identical new oak barrels and monitored for malolactic depletion using paper chromatography, with enzymatic confirmation at the Virginia Tech Analytical Services Lab after completion. After the completion of malolactic fermentation, 30 ppm SO2 was added.
Sensory analysis was completed by a panel of 25 wine producers and viticulturalists. Wines were presented blind in randomly numbered glasses. Panelists were presented with three wines, two of one type and one of another, and asked to identify which wine was different (a triangle test). There were three tasting groups with different tasting order and the unique wine in the triangle test balanced between groups. They were then asked to score each wine on a scale of 0 to 10 for fruit intensity, structure and ripeness. Panelists were also given open ended questions to describe the wines.
Results
East Block, Ballerina Canopy
In the Ballerina block, berries from the high conductivity soil were considerably smaller than those from low conductivity soils, however there were no notable differences in cluster weight, number of berries per cluster, or weight per berry between grapes grown in high vs. low conductivity environments (Figure 4).
Grapes from the high conductivity zone produced juice with slightly higher Brix, lower pH, and higher TA than grapes from the low conductivity zone (Table 1). The pH difference was also seen in finished wine (Table 2). Both wines had high color intensity, with wine from the low conductivity zone showing higher intensity (Table 3). Most phenolic measures, however, such as anthocyanins, tannins and skin phenolics were slightly higher in wine from high conductivity zones (Table 4, 5).
In a triangle test of high vs. low conductivity wines, 10 out of 25 respondents were able to distinguish which wine was different, indicating the wine were not significantly different (Z=0.49, p= 0.69). There were no significant differences in scores for fruit intensity, structure or ripeness.
West Block, VSP Canopy
There were no notable differences in cluster weight, number of berries or berry weight between conductivity zones (Figure 5). At harvest, fruit from the high conductivity zone had higher brix and lower TA than fruit from the high conductivity zone (Table 6), indicating it was potentially riper. The disparity in TA at harvest is much larger than would be expected, and is not seen in the finished wine, indicating there may be some error in this measurement.
Wine made from fruit from the high conductivity portion of the block completed fermentation with considerably lower pH (Table 7). This wine also had higher color intensity, lower hue (Table 8), and higher levels of anthocyanins (Table 9), though these differences were small. There also slightly higher phenolics, and tannins (Table 10) in the wine from the high conductivity zone. This may be due to higher extractability of slightly riper fruit (higher Brix).
In a triangle test of high vs. low conductivity wines, 12 out of 25 respondents were able to distinguish which wine was different, indicating the wines were not significantly different (Z=1.34, p= 0.09). There were no significant differences in scores for structure or ripeness. However, the low conductivity wine had a mean score for ripeness of 6.64 (SD=1.8) while the high conductivity wine had a mean ripeness score of 5.73 (SD=1.75). This difference is small but significant (F=7.04, p=0.02).
Comparisons to 2017 (Table 11)
East Block, Ballerina
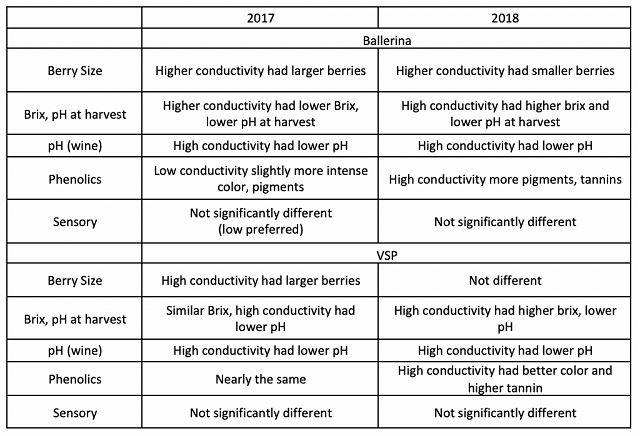
In the 2017 season, wine from low conductivity soils had several parameters indicating higher level of ripeness including higher Brix, higher pH, lower TA, lower YAN, more intense color, higher anthocyanins and polymeric pigments. However, there were no real trends in skin or seed phenolics or sensory differences in 2017. In 2018, wine from high conductivity soils had higher Brix, but pH was lower. Once again, the phenolic measurements showed no clear trend.
West Block, VSP
In 2017, high conductivity soils produced fruit with slightly higher Brix, lower pH, higher TA, and wines with lower pH and lower phenolics overall. The brix and pH effects were similar in both years, but the effects on phenolics were not. There were no significant differences in sensory characteristics in 2017.
Conclusions
The growing season for 2018 included much higher rainfall than 2017. Previous work has looked at the effect of different soil water conditions on EC. EC itself will change with different soil water conditions, but the difference between zones remains consistent, indicating that if a zone is lower in conductivity in a wet year, it will also be lower in conductivity in a dry year1. However, the response of vines to available water may change from year to year, with a wet year adding additional stressors.
Another confounding factor at Barren Ridge is the high proportion of rock content in the high conductivity plot. Though the soil exhibits high conductivity, the large amount of rock may allow for better water drainage overall, a difference expected to be seen more in a wet year like 2018 than a dry year like 2017. In this way, the interpretation of soil conductivity must be accompanied by soil analysis to determine the reason for conductivity. Here, the texture of the soil may be having a strong influence on the conductivity and obscuring the predictions.
Figures & Tables
Figure 1: EM mapping and sampling layout at Barren Ridge Vineyards, Hydro Geo
Areas of blue and green indicate low conductivity, areas of orange and yellow indicate high conductivity.
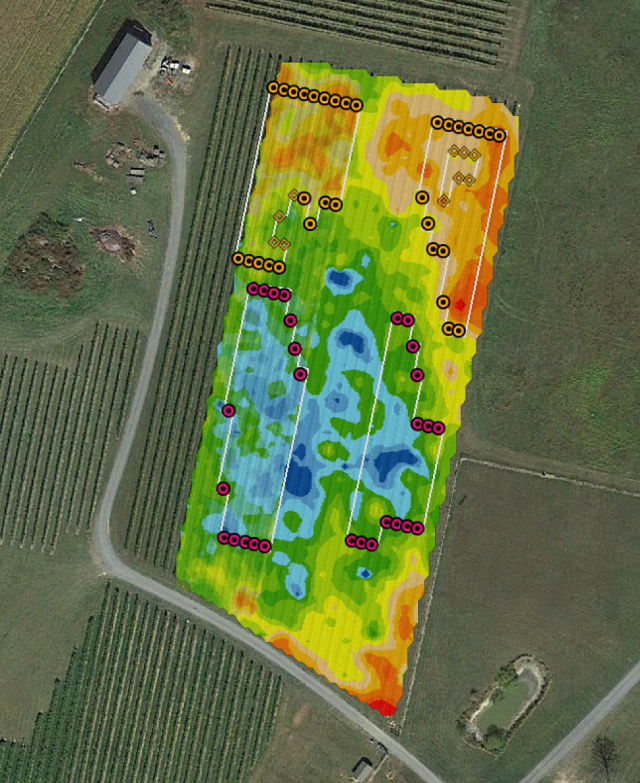
Figure 2: Designated “high” and “low” conductivity areas for differential harvest
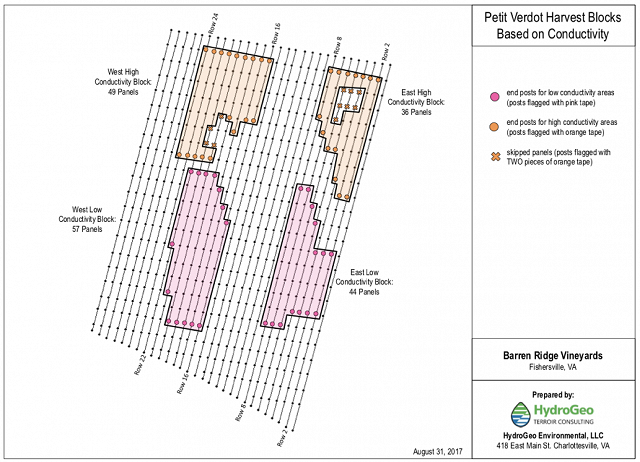
Figure 3: Soil analysis of high and low conductivity plots in at Barren Ridge Vineyards (contributed by Hydro Geo) A: East Block, Ballerina Canopy B: West Block, VSP Canopy
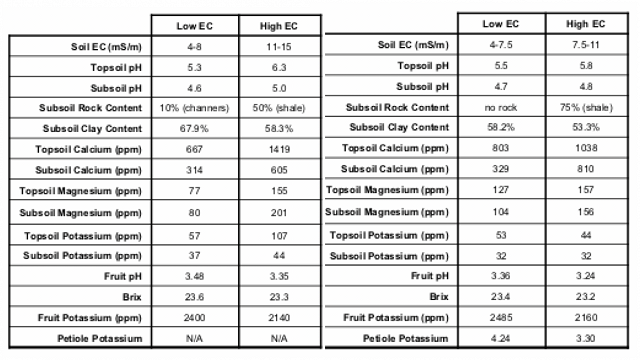
Figure 4: Cluster weight, number of berries per cluster, or weight per berry of grapes grown in high vs. low conductivity environments. East Block, Ballerina Canopy
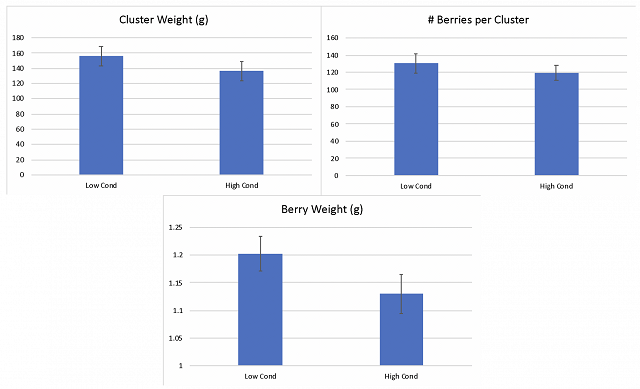
Table 1: Juice chemistry (East Block, Ballerina Canopy) (In-house data)

Table 2: Wine Chemistry for grapes grown in high and low conductivity soils (East Block, Ballerina Canopy) (ICV labs)

Table 3: Color in wines from high and low conductivity soils (East Block, Ballerina Canopy) (ICV labs)
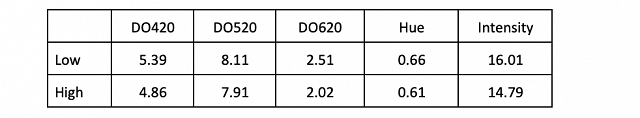
Table 4: Anthocyanins found in wines from different conductivity soils (East Block, Ballerina Canopy) (ETS labs)
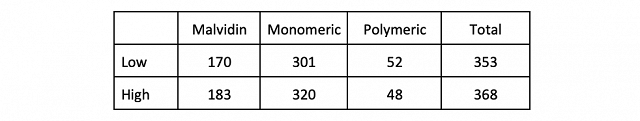
Table 5: Skin and seed phenolics found in wines from different conductivity soils (East Block, Ballerina Canopy) (ETS labs)
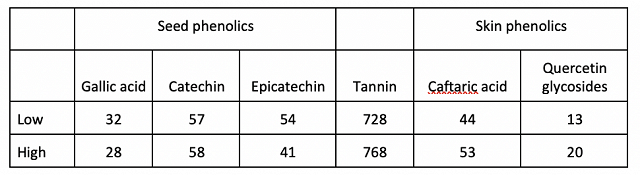
Figure 5: Cluster Weight, Number of Berries per Cluster, Berry Weight for Low and High Conductivity plots. West Block, VSP
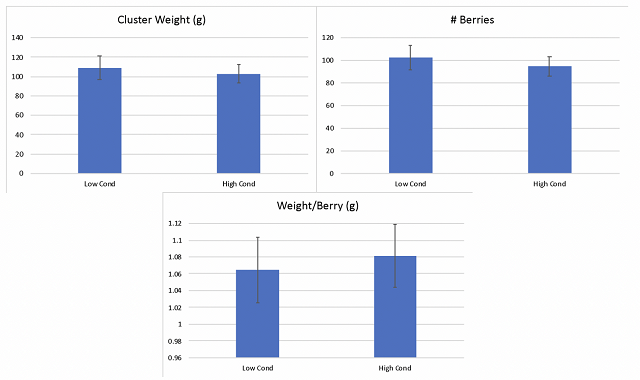
Table 6: Juice Chemistry, West Block VSP (In-house data)

Table 7: Wine Chemistry for grapes grown in high and low conductivity soils, West Block, VSP (ICV labs)

Table 8: Color in wines from high and low conductivity soils, West Block, VSP (ICV labs)
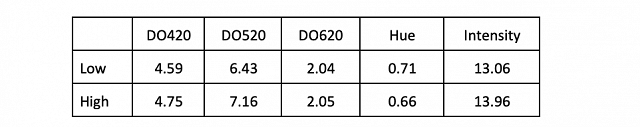
Table 9: Anthocyanins found in wines from Low and High conductivity, West Block, VSP (ETS labs)
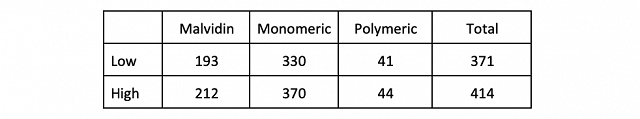
Table 10: Phenolic measurement for wines from low and high conductivity soils, West Block, VSP (ETS labs)
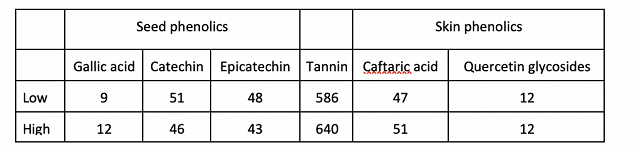
Table 11: Comparison of trends in major grape and wine parameters from 2017 and 2018
References
(1) Grisso, R. D. (Robert D.; Alley, M. M.; Holshouser, D. L.; Thomason, W. E. Precision Farming Tools. Soil Electrical Conductivity. Soil Electrical Conductivity 2005.
(2) Barbosa, R.; Overstreet, C. What Is Soil Electrical Conductivity? LSU Ag Center Publication No. 3185.
(3) Lowe, K. Vineyard Soils. In UC Davis Online Certificate Program.
(4) Wolf, T. K. Wine Grape Production Guide for Eastern North America; Plant and Life Sciences Publishing: Ithaca, New York, 2008.