Influence of Soil Conductivity on Vineyard Maturity (2014)

Benoit Pineau

Pollak Vineyards

Purpose: Identify effects of soil conductivity variations on vineyard dynamics and winemaking.  Methods: A 3-acre block of Cab Franc was mapped according to soil conductivity by Hydrogeo Environmental LLC; similar sized plots (approx. 0.75 acres) with a large differential in conductivity were identified and managed identically. Maturity control was performed separately on these two blocks, identified as low conductivity (LC) and high conductivity (HC).  The blocks were harvested and processed identically but separately.  Results: There were no variations in maturity control, and triangle testing showed no significant taste difference between groups. Lab analysis shows differences in micronutrient content of finished wines. Conclusion: Electromagnetic conductivity was correlated with micronutrient content in finished wines.

Presented at Trump Winery on January 28, 2015

Introduction

         Electromagnetic conductivity soil mapping is a measurement of electrical current that often times correlates with various soil characteristics that determine plant health. These characteristics can include drainage, salt composition, nutrient density, and soil character. High electrical conductivity correlates to high cation exchange capacity, and is often found in drier soils (due to less salt leaching) or clay soils.  When conductivity mapping is used in vineyards, it may provide valuable information on vineyard management, and help the winemaker select the most productive and hearty vines.

Methods

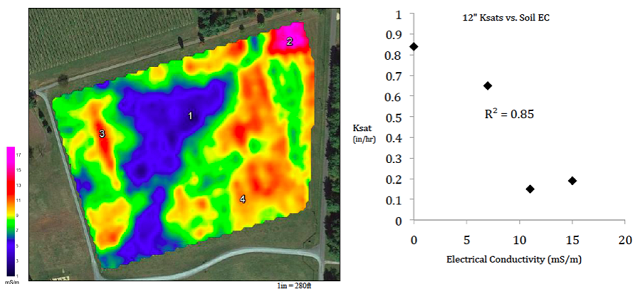
         Electromagnetic (EM) conductivity mapping of a 3-acre Cab Franc block facilitated differentiation of two distinct soil types within the vineyard: a clay soil and a sandy clay loam with gravels.  Similar sized plots (approx. 0.75 acres) of each soil type were delineated and managed identically (figure 1). The clay soil is identified in this study as high conductivity (HC) and the sandy clay loam as low conductivity (LC), based on their apparent conductivity values (as measured with the Geonics EM38-MK2 EM instrument).


         Maturity control was performed separately on the two blocks, and both were harvested and processed identically but separately.  Two t-bins of each were fermented (Premier Cru 20g/hL)), pressed, and racked to 5 identical barrels.  All barrels went through MLF with bacteria added (VP41 1g/hL) and were treated with 5g/hL SO2 and 0.3g/L H2T to adjust pH below 3.8. 

Results

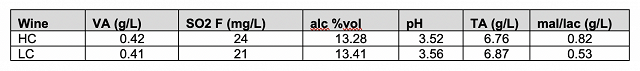
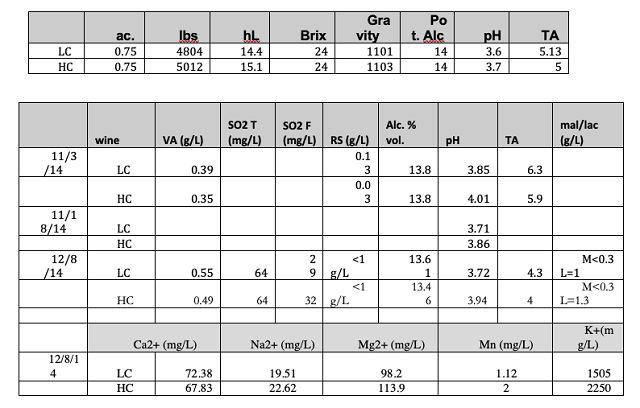
         Maturity control showed no significant variations in Brix, pH, TA or berry weight. Lab analysis of standard metrics shows minimal differences between the high and low conductivity fractions (Figure 1). However, there are differences in some micronutrients such as potassium, which are elevated in the high conductivity fraction. 

         Triangle testing showed no discernable taste difference between groups. However, among those that were able to tell a difference, there was a strong sensory preference for the high conductivity fraction (Figure 2). 

Discussion

         Increased or decreased levels of potassium in finished wines can have a drastic effect on pH and flavor profiles. In this experiment, relative soil potassium levels correlate to relative potassium levels in the finished wines.   Conductivity mapping of vineyard soils shows promise as a tool to help characterize the spatial variability of potassium and other nutrients important to viticulture and wine quality.

         Based on this study and numerous other trials performed by HydroGeo Environmental, LLC, soil conductivity mapping alone appears to provide little information applicable to winemaking; however, when utilized in combination with extensive ground-truth data (i.e. plant tissue data where available, soil chemical, hydrologic and physical data), can be a powerful tool to help characterize vineyard site variability as it applies to vine performance and wine quality.

         More experiments like this will help build the collective knowledge base of how soil conductivity mapping applies not only to characterizing site variability, but how it can best be applied in the context of viticulture. Annual repetition of this experiment will be important, as well as similar experiments with other varietals/blocks.


Conclusion

         Variations in the soil conductivity of this Cab Franc block are correlated with micronutrient and preference variations in the wine.


References

https://pubs.ext.vt.edu/442/442-508/442-508_pdf.pdf

https://www.lsuagcenter.com/NR/rdonlyres/E57E82A0-3B99-4DEE-99B5-CF2AD7C43AEF/77101/pub3185whatissoilelectricalconductivityHIGHRES.pdf

Soil Electrical Conductivity. USDA NRCS.  Accessed 2016.https://www.nrcs.usda.gov/Internet/FSE_DOCUMENTS/nrcs142p2_053280.pdf


Download Report

Influence of Soil Conductivity on Vineyard Maturity (2014)

Matthieu Finot

King Family Vineyards

Purpose

Identify effects of soil conductivity variations on vineyard dynamics and winemaking.  Methods: A 3-acre block of Merlot was mapped according to electromagnetic conductivity by Hydrogeo Environmental LLC. Similar sized plots (with a large differential in conductivity) were identified and managed identically. Maturity control was performed separately on these two blocks (when possible). The blocks were harvested and processed identically but separately Results: Lab analysis shows minimal differences between the high and low conductivity fractions. However, triangle testing showed a significantly (p<0.05) discernable difference between the two. There was a strong sensory preference for the high conductivity fraction. Discussion: As a new technology, it is unclear what information soil conductivity mapping can provide, and how to integrate it into winemaking. Experiments like these will determine the usefulness of the technology over time. Annual repetition of this experiment will be important, as well as similar experiments with other varietals/blocks. Conclusion: Variations in the soil conductivity of this Merlot block are correlated with sensory variations in the wine.

Presented at Trump Winery on January 28, 2015

Introduction

Electromagnetic conductivity soil mapping is a measurement of electrical current that often times correlates with various soil characteristics that determine plant health. These characteristics can include drainage, salt composition, nutrient density, and soil character. High electrical conductivity correlates to high cation exchange capacity, and is often found in drier soils (due to less salt leaching) or clay soils. When conductivity mapping is used in vineyards, it may provide valuable information on vineyard management, and help the winemaker select the most productive and hearty vines.

Methods

Electromagnetic (EM) conductivity mapping of a 3-acre Merlot block facilitated differentiation of two distinct soil types within the vineyard: a clay soil and a sandy clay loam with gravels. Similar sized plots (approx. 0.75 acres) of each soil type were delineated and managed identically. The clay soil is identified in this study as high conductivity (HC) and the sandy clay loam as low conductivity (LC), based on their apparent conductivity values (as measured with the Geonics EM38-MK2 EM instrument).

Maturity control was performed separately on these two blocks (when possible), identified as low conductivity (LC) and high conductivity (HC). The blocks were harvested and processed identically but separately. Both were inoculated with D21 (80g/bin), completed AF, racked to barrel, and completed MLF.

Results

Lab analysis at harvest (Figure 1) and post MLF (Figure 2) both show minimal differences between the high and low conductivity fractions (Figure 1). However, triangle testing showed a significantly (p<0.05) discernable difference between the two. Additionally, there was a strong sensory preference for the high conductivity fraction (Figure 3).

Figure 1

Figure 2

Figure 3


Discussion

Though there was a discernable difference between finished wines from the different conductivity areas, soil conductivity mapping alone appears to provide little information applicable to winemaking; however, when utilized in combination with extensive ground-truth data (i.e. plant tissue data where available, soil chemical, hydrologic and physical data), can be a powerful tool to help characterize vineyard site variability as it applies to vine performance and wine quality.

More experiments like this will help build the collective knowledge base of how soil conductivity mapping applies not only to characterizing site variability, but how it can best be applied in the context of viticulture. Annual repetition of this experiment will be important, as well as similar experiments with other varietals/blocks

Conclusion

Variations in the soil conductivity of this Merlot block are correlated with sensory variations in the wine.


References
Soil Electrical Conductivity. USDA NRCS.  Accessed 2016. https://www.nrcs.usda.gov/Internet/FSE_DOCUMENTS/nrcs142p2_053280.pd

Download Report

Contact

Sign up for our Mailing List