Effect of Merlot crop load on grape and wine quality (2019)
Joseph Geller, Jonathan Wheeler, Dr. Tim Jordan
Trump Winery
Summary
Common inherited wisdom in viticulture says that smaller crop loads lead to better wine. However, most of the published reports on crop load were done in widely varying ranges (from 4-12 ton/acre) and in regions other than Virginia. Crop thinning as little as 1.5 tons/acre comes at considerable cost. In this study, crop thinning to a target of 3 vs. 4.5 tons/acre was done on the Merlot block of the Chateau vineyard of Trump Winery in a randomized complete block design. This resulted in significantly different crop load, with no significant difference in ripening parameters (Brix, pH, TA) or berry weight. Grape and wine color metrics were higher for the low crop treatment, however these were not significantly different in sensory analysis. Virginia has a wide range of variation between vintages, and vines may be able to carry more crop in warm, dry vintages such as 2019 while the results maybe different in cool, wet vintages such as 2018. Plans are to repeat this study in subsequent vintages.
Introduction
Common inherited wisdom in viticulture says that smaller crop loads lead to better wine1,2. Smaller crop loads are often achieved by pruning, cluster thinning, or deficit irrigation1 and are credited with hastening ripening, increased fruit quality, decreased disease (especially Botrytis), and better long term vine balance1–3. However, crop reduction comes at measurable cost. In her landmark crop load study in Oregon, Patty Skinkis estimated that a 25-50% crop reduction came a cost of $700-800 per acre. Participants in the Oregon study were cropping at 2-2.75 tons/acre on average. In this study, reducing premium Merlot crop from 4.5 to 3 tons/acre can be estimated to forego $36004.
Previous studies examining the effect of altered crop load in different regions with different grape varieties have shown markedly mixed results. Some have found increases in sugar accumulation, color, and anthocyanins with lower crop load while others have found no difference, or even higher levels of unwanted characteristics such as vegetal/green pepper character1,3,5–8. Positive effects of crop load reduction seem to be more pronounced in situations of over-cropping, such as hybrids with large cluster sizes, in low vigor sites or varieties, or in overall high crop years2,3.
In her landmark Statewide Crop Load Study in Oregon, Dr. Patty Skinkis of Oregon State University has coordinated study of crop load in Pinot Noir over 8 year (with two years remaining in the study) including 24 different sites across 6 AVA’s. Using standardized methodology in production scale vineyards, the study has found few consistent differences in Brix, pH, or TA. The most consistent differences have been seen with 10-40% higher levels of anthocyanins in lower crop treatments in high crop load years, but even these are not seen at most sites. Preliminary conclusions to this study indicate that site and vintage have a higher impact on quality than yield, and that Oregon growers may be able to sustain higher crop loads than the current standard of 2-2.7 t/acre with little loss in quality2,9–11.
Virginia has higher vigor and crop load than Oregon, indicating trends seen during “high yield” years in Oregon may be more seen more consistently in Virginia. The experimental design of Dr. Skinkis study in Oregon was adapted here to explore the effect of crop load on a premium Merlot vineyard at Trump Winery that is prone to high yields (4-5 tons/acre without adjustments) and non-uniform ripening. After cluster thinning, fruit maturity, yield, phenolics and wine chemistry were measured.
Methods
Vineyard
The experiment was conducted at Trump Winery, near Charlottesville, Virginia, in a 10.77 acre block of Merlot. Planted in 2004, the Merlot is clone 181 on 3309C rootstock. The vineyard design is 7 ft by 3.33 ft spacing on a VSP trellis, and the vines are trained to a unilateral cordon. The site is situated at 1000-ft above sea level, on a 10-18° slope oriented 30°, east-southeast.
A randomized complete block design with longitudinal measures was used to determine how cropping level affected disease incidence and ripening kinetics over the three to four weeks preceding harvest. Crop level treatments were applied at berry touch using lag phase cluster sampling to determine the balance needed to achieve desired yield. On June 29, cluster thinning was done at two treatment levels with large wings and stacked bunches also removed:
- 2 clusters/shoot (approximately 4 clusters per linear foot) to a target of 4.5 tons/acre
- 1.5 clusters/shoot (alternating 1 cluster/shoot and 2 clusters/shoot)(approximately 3 clusters per linear foot) to a target of 3 tons/acre
Block and treatment assignment:
There were four blocks identified within the vineyard, each containing 9 rows. Treatment position within each block was assigned randomly with four consecutive rows cluster thinned to two shoots per cluster while five consecutive rows were thinned to 1.5 shoots per cluster. The difference in number of rows was to ensure proper yields of each treatment for winemaking. Buffer rows bounded the experimental block on the top and bottom of the vineyard so that none of the treatment rows were exposed to edge effects except at the end of the rows. For each treatment, sampling locations were assigned for the inner rows only, again to act as a buffer against potential edge effects of the treatment. Figure 1 shows a map of blocks and treatments.
Sampling
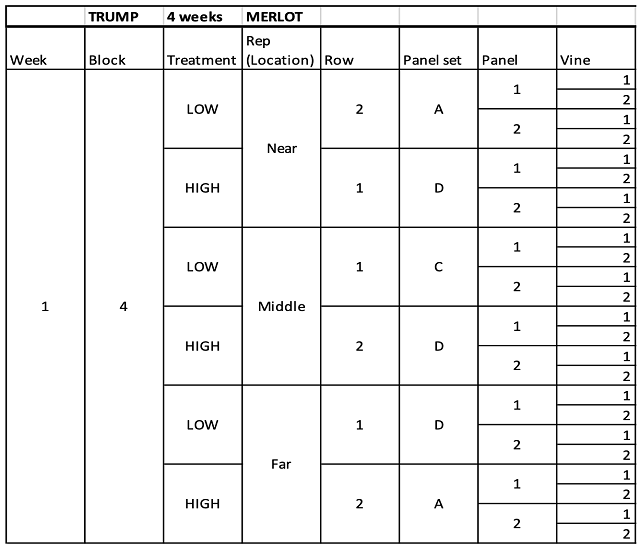
Randomly selected, paired samples for each block were determined for each sampling event. A sample location consisted of three consecutive panels of six mature vines per panel. If a panel did not have six mature vines, the next full panel was used. An effort was made to prevent sampling in a previously sampled location by flagging the beginning and end of a three-panel sample.
Disease incidence:
Disease incidence was measured using a visual count of clusters per vine. Only the first three vines of every panel were sampled. A tally was recorded of total clusters per vine and number of diseased clusters per vine. A diseased cluster included any indication of rot (Botrytis, sour, ripe, black rot, mildew) caused by any damage factor (insect, animal, disease, environmental, mechanical). Dividing diseased clusters by total clusters per vine provided a proportion of diseased clusters per vine.
Ripening kinetics
Ripening was measured using weekly 100-count berry samples with three paired samples per treatment per block from the near, middle, and far ends of the rows. Sampling commenced at 18 °Brix and was done weekly up until harvest. The final berry sample was taken on the day of harvest. Each berry sample included selecting six berries per vine across all three panels (18 vines) for a total of 108 berries. The six berries were selected at random from six different clusters per vine by systematically sampling the top, middle, and bottom of clusters on the east and west faces of clusters. Weekly vineyard samples were processed and tested for Brix, pH, and TA. At harvest, pooled samples from three treatment blocks were also sent to ETS labs (St. Helena, California) for phenolic testing.
Yield
Yield was measured at harvest by the removal of six clusters from three locations per treatment (at the near, middle, and far ends of the rows). Cluster selection was random by removing no more than one cluster per vine and a total of two clusters per panel. An effort was made to remove two clusters on each side of the trellis panel (east, west). Clusters were weighed individually and as a group to record individual and average cluster weights. Each cluster was also broken down into individual berries to count the number of berries per cluster, and to weigh individual berries per cluster to record number of berries per cluster and average berry weights per cluster.
Winery methods
Vineyard replicates were combined for winemaking. All winemaking operations were the same between lots. All blocks were harvested on the same day and refrigerated overnight prior to processing. Grapes were crushed and destemmed with addition of 50 ppm SO2, 3 g/100kg Laffort Grand Cru Lafasse enzyme, and Laffort Tannin VR Supra into close-topped, temperature controlled stainless steel fermenters. Must was allowed to cold soak for 4 days at 40°F. Tartaric acid (3 g/L) was added during cold soak. At the end of cold soak, tanks were inoculated with 15 g/hL Laffort F15 rehydrated in 15 g/hL GoFerm. Fermentations were monitored daily for Brix and temperature with the addition of 25 g/hL Fermaid K at 1/3 sugar depletion. Fermentations were punched down twice per day and pumped over once per day. After the completion of fermentation, wine was drained and pressed, then inoculated with CHR Hansen Viniflora Oenos prior to racking to barrels for malolactic fermentation. Malic acid conversion was confirmed with enzymatic analysis prior to racking and addition of 50 ppm SO2. Wine was monitored monthly for SO2 and VA.
Statistical analysis of vineyard results
Analysis of variance (ANOVA) was used to test if between-subject (cropping level) sample variances were homogeneous. Within subject factors were blocks and time (week). A paired t-test was used to determine if sample means differed. An alpha = 0.05 was used to assess statistical difference.
Sensory analysis was completed by a panel of 26 wine producers. Due to social distancing restrictions at the time of COVID-19, wines were shipped to panelists in randomly numbered sample bottles. Tasters were presented with three wines, two of one type and one of another, and asked to identify which wine was different (a triangle test). There were three tasting groups with the unique wine in the triangle test balanced between groups. Tasters were then asked to score each wine on a scale of 0 to 10 for aromatic intensity, fruit intensity, perception of ripeness, color and structure. They were also given open ended questions to describe the wines. Results for the triangle test were analyzed using a one-tailed Z test. Descriptive scores were analyzed using repeated measures ANOVA.
Results
Cluster removal successfully differentiated crop levels. At the time of harvest, the high crop averaged 4.09 clusters/foot with 4.12 lbs/foot while the low crop averaged 2.68 clusters/foot with 1.33 lbs/foot. These values were significantly different (t=13.6, p<0.0001)(Figure 2). There was no significant different between treatments in sugar accumulation (Brix), pH increase, or TA decrease (Figure 3). Differences in crop level also did not affect mean berry weight (Figure 4). Phenolic measurements in grapes at harvest were lower in the high crop treatment than the low crop treatment (Table 1) with notably lower anthocyanins and tannins in the high crop treatment.
Vineyard replicates were pooled for winemaking. There was no difference in juice chemistry or basic wine chemistry between treatments (Tables 2&3). Fermentation was robust and progressed at the same rate between the two treatments (Figure 5). Wine from the low crop treatment had notably higher color and anthocyanin content than wine from the high crop treatment (Figure 6, Table 4). Wine from the low crop treatment also had higher tannin, though the other phenolics were largely the same between treatments (Table 5).
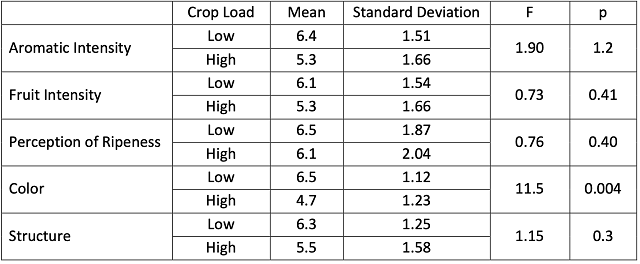
In a triangle test, 9 out of 26 respondents were able to distinguish the wines, indicating the wines were not significantly different. The wine from low crop load had significantly higher scores for color than the wine from high crop load (Table 6), indicating differences found in lab metrics were also visually perceptible. When asked what distinguished the wines in the triangle test, several respondents cited color. Open ended questions indicate that the wines were not very different. During discussion, many participants indicated the difference between the wine was small enough they did not feel it was worth the cost. Others felt that, for some wines, the cost was worth the increase in quality.
Figure 1: (A) The Chateau Vineyard at Trump Winery was divided into four blocks. (B) Each block was further subdivided into two treatments; high crop (pink) and low crop (blue) with high crop treatment receiving four consecutive rows and low crop treatment receiving five consecutive rows. Treatments were assigned randomly within the block. At each sampling event, each treatment was sampled three times, at the near, middle and far ends of the rows. (C) Image of high crop treatment taken on July 31,2020. (D) Image of low crop treatment taken on July 31, 2019)
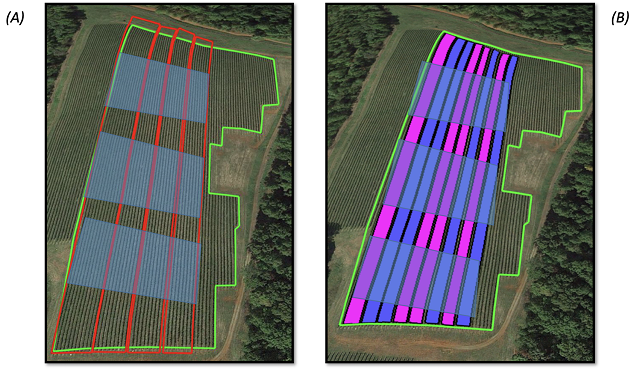
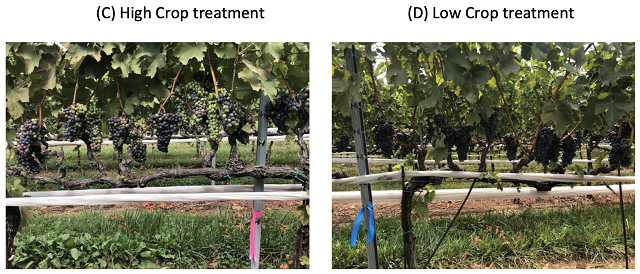
Figure 2: Yield from high and low crop treatments was significantly different at harvest.
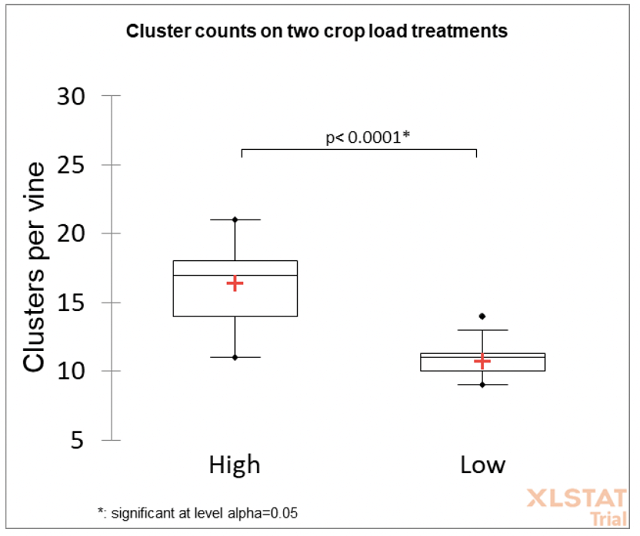
Figure 3: There were no significant differences in ripening parameters between treatments
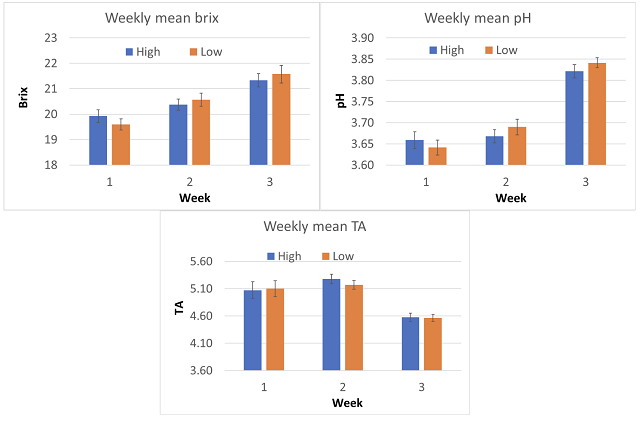
Figure 4: There were no significant differences in berry weight between treatments at harvest.
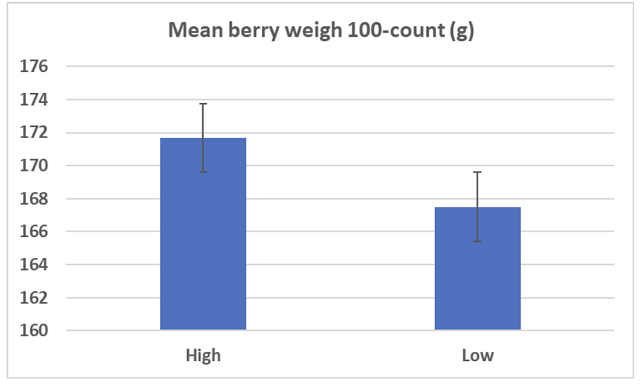
Table 1: Phenolic compounds found in grape samples (mg/L) (ETS Labs)
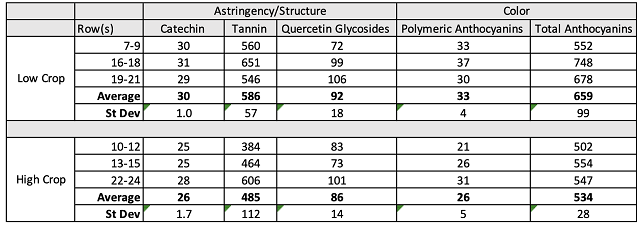
Figure 5: Fermentation kinetics for high and low crop Merlot (In-house data)
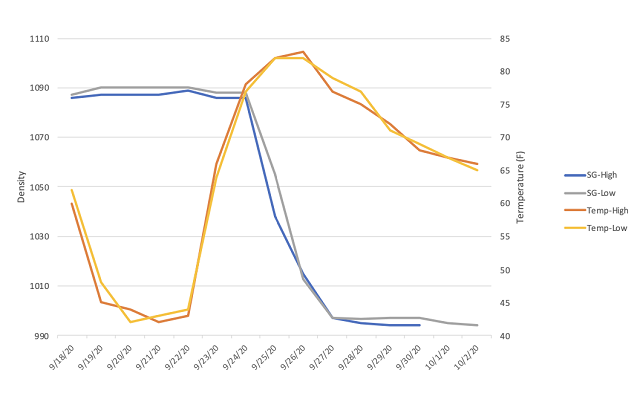
Table 2: Juice Chemistry for high and low crop Merlot (in-house data)
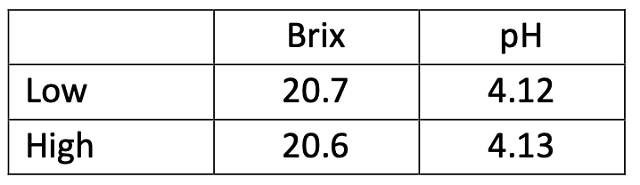
Table 3: Chemistry for wine from high and low crop Merlot (ICV Labs)
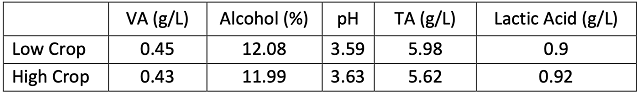
Figure 6: Color Metrics for wine from high and low crop Merlot (ICV labs)
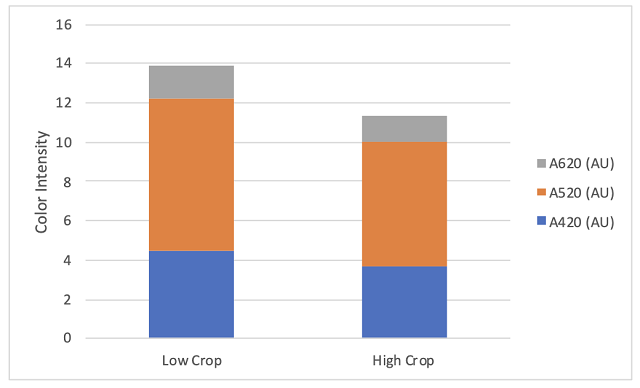
Table 4: Anthocyanins in wine from high and low crop Merlot (mg/L) (ETS Labs)
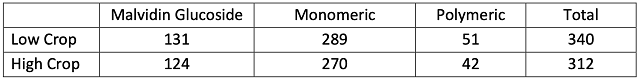
Table 5: Phenolics in wine made from two treatments of Merlot (mg/L)(ETS Labs)
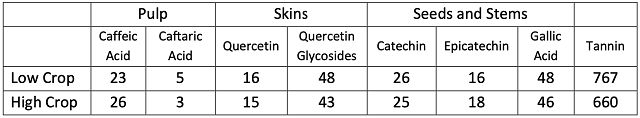
Table 6: Sensory impressions of two treatments of Merlot using repeated measures ANOVA
References
(1) Matthews, M. A. Terroir and Other Myths of Winegrowing; University of California Press: Oakland, California, 2015.
(2) Skinkis, P. The Low Down on High Yields: Challenging Yield-Quality Standards for Oregon Pinot Noir, 2017.
(3) Moreno Luna, L. H.; Reynolds, A. G.; Di Profio, F. Crop Level and Harvest Date Impact Composition of Four Ontario Winegrape Cultivars. I. Yield, Fruit, and Wine Composition. American Journal of Enology and Viticulture 2017, 68 (4), 431–446.
(4) Wood, V.; Custer, S.; Watson, K.; Alper, D. Virginia 2018 Commercial Grape Report. 11.
(5) Wolf, T. K.; Dry, P. R.; Iland, P. G.; Botting, D.; Dick, J.; Kennedy, U.; Ristic, R. Response of Shiraz Grapevines to Five Different Training Systems in the Barossa Valley, Australia. Australian Journal of Grape and Wine Research2003, 9 (2), 82–95.
(6) Sinton, T. H.; Ough, C. S.; Kissler, J. J.; Kasimatis, A. N. Grape Juice Indicators for Prediction of Potential Wine Quality. I. Relationship Between Crop Level, Juice and Wine Composition, and Wine Sensory Ratings and Scores. Am J Enol Vitic. 1978, 29 (4), 267–271.
(7) Chapman, D. M.; Matthews, M. A.; Guinard, J.-X. Sensory Attributes of Cabernet Sauvignon Wines Made from Vines with Different Crop Yields. Am J Enol Vitic. 2004, 55 (4), 325–334.
(8) Bravdo, B.; Hepner, Y.; Loinger, C.; Cohen, S.; Tabacman, H. Effect of Crop Level and Crop Load on Growth, Yield, Must and Wine Composition, and Quality of Cabernet Sauvignon. Am J Enol Vitic. 1985, 36 (2), 125–131.
(9) Skinkis, P. Pinot Noir Crop Load Wine Technical Tasting Challenges the Yield-Quality Relationship. Oregon State University Vine to Wine 2020.
(10) Skinkis, P.; Schreiner, R. P. Defining Crop Load Metrics for Quality Pinot Noir Production in Oregon; Unified Grant Management for Viticulture and Enology Interim Report Summary; 2016.
(11) Uzes, D. M.; Skinkis, P. A. Factors Influencing Yield Management of Pinot Noir Vineyards in Oregon. Journal of Extension 2016, 54 (3).
Appendix A: Example sample grid for one block, one week. Four blocks were sampled per week.