Effect of crop load on grape and wine quality, a review
Joy Ting
May 2020

Fertile Virginia soils can sometimes lead to vigorous vine growth and high crop loads. Viticulturists commonly reduce crop load by pruning and cluster thinning to decrease shading and disease pressure, increase sunlight exposure and encourage ripening. Crop reduction is also thought to improve overall vine balance and prevent stress that can lead to lower fruitfulness in subsequent years (1). However, crop reduction comes at measurable cost. In her landmark crop load study in Oregon, where participants were routinely cropping at 2-2.75 tons/acre, Patty Skinis estimated that a 25-50% crop reduction came a cost of $700-800 per acre. In Virginia, the commercial cost of reducing premium Merlot crop from 4.5 to 3 tons/acre (as done in the Trump Crop Load trial) averages over $3750 (2). The question then arises: how much crop should be dropped to achieve ripeness and quality? Are we thinning too much or not enough? What is the right balance, for the vine as well as the bank account?
Previous studies examining the effect of altered crop load in different regions with different grape varieties have shown markedly mixed results. Some studies (3–5) find important differences with crop reduction including faster maturity, better color, higher anthocyanins, and higher wine quality scores while others find little to no differences at all (1,6,7). Some even report decreases in wine quality with lower crop level as negative flavor and aromas such as methoxypyrazine are concentrated (8) The attached report summarizes outcomes from many crop load studies. Interpretation of these studies is complicated by the differences in growing region, grape variety, and whether grapes were harvested on the same day or at the same level of maturity. Moreno Luna et al (2017)(1) studied both crop level and harvest date and conclude that differences between crop load treatments could be overcome with longer hang time, however in some regions (like Virginia), longer time includes greater risk of precipitation and disease. The method of crop management may also matter, with pruning more effective than crop thinning (8). Some studies find few differences until very high crop loads are reached (7,8). Many studies report vine phenology and grape chemistry but do not include examination of flavor and aroma of wine, either chemically or by sensory analysis.

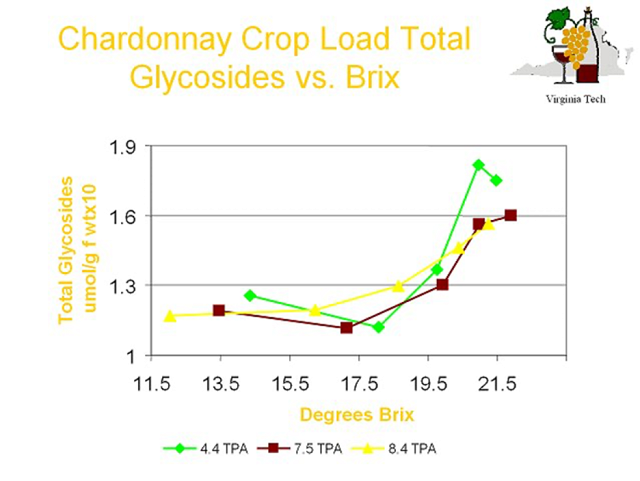
Figure 2: Lower crop load leads to greater accumulation of total glycosides over time. From Zoecklein (2000)
In a presentation to the Virginia Vineyards Association in 2000, Dr. Bruce Zoecklein of Virginia Tech presented data examining the relationship between yield and wine quality in Chardonnay and Cabernet Sauvignon in Winchester, Virginia (9). In addition to Brix, pH and TA, these studies included a measure of phenol-free glycosides, the pool of secondary metabolites that will be transformed into flavor and aroma in the wine. In Chardonnay cropped to 3.7, 7.3, and 10.2 tons/acre on an open lyre system, higher crop load led to decreased Brix with little change in pH or TA. The lower crop load treatment also had significantly higher total glycosides, which were correlated with wine quality through sensory analysis. When total glycosides were measured at different Brix levels during ripening, they were relatively the same for each crop load relative to Brix until grapes accumulated 20.5°Brix, at which point the lower crop load (4.4 tons/acre in this case) had notably higher accumulation of these metabolites. This relationship was shown to continue to diverge as Brix increased to 24.5°Brix. A similar study of in Cabernet Sauvignon harvested at 20.5°Brix showed differences in phenol-free glycosides between crop loads of 7.4 tons/acre and 10.4 tons/acre with the lower crop load again accumulating a larger pool of potential flavor/aroma compounds. In both Chardonnay and Cabernet Sauvignon, wines with higher phenol-free glycosides were perceived to be different in sensory analysis. These results underscore the fact that general grape chemistry (Brix, pH, TA) does not always fully describe the quality potential of the grapes.
When taken as a whole, the literature suggests that for any given situation, there is a range of crop load that will produce comparable quality wine, with lower quality wine produced when crop load is too high or too low. The most cost effective management strategy, then, would be to maintain the vineyard on the higher end of the range of comparable quality. Unfortunately, given the large ranges examined in the literature with differing results, there is no clear formula to determine the right amount of crop to grow on a given site. These values depend on factors such as vine vigor, leaf area, vintage, variety, water availability, length of the growing season and many others (3,4,7,8) In concluding his presentation on crop load, Zoecklein said
The relationships between yield and quality are complex...There may be no exact point when overcropping begins (9).
The best approach to determine the right crop load for a given vineyard then is by practical experimentation.
...despite over 50 years of research investigating cluster thinning, crop size, and yield effects on vine physiology, vine size, yield components, berry composition, and wine composition and quality, there are many contradictions in the literature due to the cultivars chosen for experimentation and the circumstances under which each trial was carried out. (Luna et al, 2017)
The Oregon Statewide Crop Load Study
An impressive example of how to set up a practical experiment examining the effect of crop load on fruit and wine quality comes from the Statewide Crop Load Study conducted by Dr. Patty Skinkis of Oregon State University (7). This ongoing 10-year study (currently in year 8) has included 24 different companies across 6 AVA’s examining the effect of crop load on Oregon Pinot Noir. At each site, a randomized complete block design was used to test the effect of two or more crop levels determined by the practitioner, with three replicates per site. Crop levels were imposed as cluster thinning to 0.5, 1, 1.5, and 2 clusters per shoot as well as no reduction in clusters per shoot. Standardized sampling protocols from 10-vine sections were followed by all participants with data collected for vine phenology, yield and fruit composition (7). Data collected so far indicate that there is considerable difference in yield per treatment each year, but differences in Brix have been seen only in high crop years. Few differences have been observed for pH, TA, or total phenolics based on yield (7).

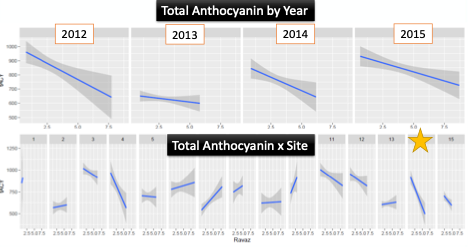
Figure 3 Anthocyanins across 15 sites in the Oregon Statewide Crop Load Study, from Skinkis 2017
The most consistent differences have been seen with 10-40% higher levels of anthocyanins in lower crop treatments in high crop load years, but even these are not seen at most sites. This change in anthocyanins might be due to physiological causes or those due to microclimate (fewer overlapping clusters). Quercetin glycoside, a phenolic molecule used by the grape as sunscreen, also differs with anthocyanins, indicating the differences in anthocyanin concentration may be due to shading more than vine physiology. Preliminary conclusions to this study indicate that the site and vintage have a higher impact on quality than yield, and that Oregon growers may be able to sustain higher crop loads than the current standard of 2-2.7 tons/acre with little loss in quality (7,10–12).
The strengths of the Oregon study are many:
- The randomized complete block design accounts for vineyard variation and allows for more efficient statistical analysis.
- A standardized experimental design and sampling protocol allows for a broader application of the experimental results beyond a single vineyard.
- The practicality of the sampling regime (a 10-vine area) is not too complicated for practical application.
Virginia has higher vigor than Oregon, indicating that the trends seen during “high yield” years in Oregon may be seen more consistently in Virginia. The Skinkis study provides a roadmap for experimental design that can be applied to Virginia vineyards with potential impacts on grape and wine quality as well as cost of wine production. The crop load study done at Trump Winery in 2019 followed an adapted version of this protocol.
References
(1) Moreno Luna, L. H.; Reynolds, A. G.; Di Profio, F. Crop Level and Harvest Date Impact Composition of Four Ontario Winegrape Cultivars. I. Yield, Fruit, and Wine Composition. American Journal of Enology and Viticulture 2017, 68 (4), 431–446.
(2) SMS Research Advisors. 2019 Virginia Commercial Grape Report. 2020.
(3) Bravdo, B.; Hepner, Y.; Loinger, C.; Cohen, S.; Tabacman, H. Effect of Crop Level and Crop Load on Growth, Yield, Must and Wine Composition, and Quality of Cabernet Sauvignon. Am J Enol Vitic. 1985, 36 (2), 125–131.
(4) Wolf, T. K. Wine Grape Production Guide for Eastern North America; Plant and Life Sciences Publishing: Ithaca, New York, 2008.
(5) Sinton, T. H.; Ough, C. S.; Kissler, J. J.; Kasimatis, A. N. Grape Juice Indicators for Prediction of Potential Wine Quality. I. Relationship Between Crop Level, Juice and Wine Composition, and Wine Sensory Ratings and Scores. Am J Enol Vitic. 1978, 29 (4), 267–271.
(6) Matthews, M. A. Terroir and Other Myths of Winegrowing; University of California Press: Oakland, California, 2015.
(7) Skinkis, P. The Low Down on High Yields: Challenging Yield-Quality Standards for Oregon Pinot Noir, 2017.
(8) Chapman, D. M.; Matthews, M. A.; Guinard, J.-X. Sensory Attributes of Cabernet Sauvignon Wines Made from Vines with Different Crop Yields. Am J Enol Vitic. 2004, 55 (4), 325–334.
(9) Zoecklein, B. W. Update of Ongoing Projects, 2000.
(10) Skinkis, P. Pinot Noir Crop Load Wine Technical Tasting Challenges the Yield-Quality Relationship. Oregon State University Vine to Wine 2020.
(11) Skinkis, P.; Schreiner, R. P. Defining Crop Load Metrics for Quality Pinot Noir Production in Oregon; Unified Grant Management for Viticulture and Enology Interim Report Summary; 2016.
(12) Uzes, D. M.; Skinkis, P. A. Factors Influencing Yield Management of Pinot Noir Vineyards in Oregon. Journal of Extension 2016, 54 (3).
