Assessing precision, accuracy, ease of use and cost of commonly used free SO2 detection methods (2020)
Phillip Fassieux, Rachel Stinson, AJ Greely
Whitehall Vineyards, Stinson Vineyards, Hark Vineyards
Summary
One of the most commonly performed lab tests in small to medium sized wineries is the measurement of free SO2. Two of the most commonly used methodologies for SO2 determination are aeration oxidation and the Hanna Titrator. In this study, three participants of varying experience levels were trained on each methodology, then asked to perform the test on replicate samples to determine precision and accuracy. Values were compared to those obtained by ETS labs (St. Helena, California). For each method, the participant with more experience showed the greatest precision while the least experienced showed low precision. Practice improved levels of precision for all participants and both methods. Overall, both methods reported systematically lower results than ETS. It is recommended that practitioners perform replicate samples when learning new techniques until the range of values falls within acceptable values for winemaking decisions.
Introduction
One of the most commonly performed lab tests in small to medium sized wineries is the measurement of free SO2. In a 2019 survey of Virginia winemakers, 60% reported checking SO2 every month with another 20% reporting checking SO2 every two months. Several different methodologies are commonly used, including aeration oxidation (50% of Virginia winemakers in our survey), Ripper titration (30%), use of specialized probes for endpoint detection (Vinmetrica), and auto-titrators (Hanna). Both Vinmetrica and Hanna use similar chemistry to the Ripper method but determine the endpoint with potentiometric indicators rather than relying on color change.
Because free SO2 values are utilized to determine addition rates, it is important that winemakers understand the proper methodology, including calibrations, as well as taking into consideration the limits of precision and accuracy for the method they are using. The purpose of this study was to determine how the performance metrics (accuracy, precision, ease of use, and cost benefit) of four common free SO2 assay methods differ from one another in real world settings. The present work includes two phases of study:
-
Determining precision and accuracy of aeration oxidation across operator experience levels
-
Comparing precision and accuracy of aeration oxidation and the Hanna titrator across operator experience levels
Methods
Prior to the first round of testing, researchers participated in a training session to review the protocol for aeration oxidation and reagent standardization. Researchers met at Hark Vineyards, reviewed a written protocol, utilized the protocol in a hands-on training session on their own aeration oxidation rig, and suggested amendments to the protocol for clarity. The edited protocol (Appendix A) was then provided for each researcher. Once trained, two rounds of SO2 determination were undertaken.
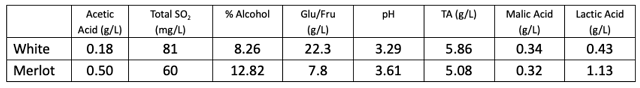
Phase 1: Researchers determined free SO2 for 5 replicate samples of two different wines (Franzia “Refreshing White” and Merlot) for a total of ten samples. General chemistry for these wines is shown in Table 1. Wine samples were prepared in topped, sealed 2oz glass bottles on the same day and shipped to researchers. Researchers were asked to complete analysis within a 4-day period. Each researcher followed instructions for reagent calibration, and all values reported are corrected based on NaOH standardization the day of testing. All tests within a single lab were conducted on the same day. A sample of each wine was prepared and shipped at the same time to ETS labs in St. Helena California for SO2 determination by aeration oxidation to serve as a reference. A second sample was measured by ICV labs (France) using an automated colorimetric method.
Phase II: Researchers determined free SO2 for five replicates each of two wines using the aeration oxidation protocol as well as the Hanna titrator for a total of 20 samples. Experimenters followed the manufacturer’s protocol for Hanna titration. A short video of this procedure can be found here: https://www.youtube.com/watch?v=jjpgWtNxrhI. All white wine samples were tested the same day; all red wine samples were tested the same day. A sample of each wine was again prepared and shipped at the same time to ETS labs in St. Helena California to serve as a control.
For each phase, each researcher conducted his/her own analysis and recorded values on a spreadsheet. From these data, summary statistics (mean, standard deviation, confidence interval and comparative performance value) were calculated to determine repeatability and reproducibility, as well as compare to the global mean and the control value (ETS labs).
Table 1: General chemistry for two wines tested for SO2 (ICV labs)
Results
Winemakers are most concerned with the accuracy (the difference between the measured value and the true value) and precision (how well our methodology will produce the same result when performed multiple times)1 of a testing method. Each of the testing strategies used in this work have been developed with the goals of accuracy and precision in mind.
For free SO2 analysis, it is difficult to determine accuracy using a standard solution because many variables in the wine matrix affect how much SO2 is bound vs. free. Instead, comparison to a mean is often used as a benchmark. But if systematic errors exist, like poorly calibrated equipment or inherent biases in the test, the mean can be far from accurate. In this study, comparison will be made to the grand mean (the average of all results from all three researchers) and comparison to the value from ETS. The comparative performance value (CPV) is an indication of how well a given laboratory’s results compare to values from other participants. The closer this number is to zero, the more consistent the results are with others. The CPV is calculated as a ratio of the number of standard deviations a single lab’s results are from the grand mean. A CPV of +/- 1.4 is considered acceptable while a value more than +/- 2.7 indicates an unacceptable level of imprecision2. This metric is most useful, however, with a large data set. Another approach utilized in this study is to compare with a certified service lab using the same methodology. ETS Labs in St. Helena, California is a highly accredited, well respected service lab with an ongoing commitment to maintaining accuracy through validation. Comparison with a respected service lab is accessible for any wine laboratory without the necessity for a large data set.
Several measures of precision are reported here. The true range indicates the spread of results actually produced through testing and indicates how disparate the results may actually be. Most winemakers are making their SO2 addition decisions based on a single run of the test, so the range of possible values is very important to know. The standard deviation is a measure of the spread of data around the mean. Based on a normal distribution of data, 68% of the readings will fall within one standard deviation on either side (positive or negative) of the mean and 95% of the readings will fall within two standard deviations of the mean. The coefficient of variation (CV), which indicates the range within which the true value of the analysis is thought to fall given the imprecision in repeated testing. CV is calculated by dividing the standard deviation of a group of readings by the mean of that same group3. Wilkes4 sets a standard CV of <5% while Iland et al3 consider <10% acceptable.
Round 1
In the first round of testing, 5 samples of each wine were measured using the aeration oxidation method. Two service labs (ETS and ICV) also evaluated these samples. For the white wine sample, ETS reported a value of 20 mg/L while ICV labs (using a different method than AO) reported a value of 16 mg/L. Means from each experimenter fell within the range between these two values, with a global mean of all in-house tests of 17.3 mg/L and all in-house tests reporting means less than the ETS value (Figure 1). For the red wine sample, ETS reported a value of 24 mg/L while ICV reported a value of 22 mg/L. The range of means from each individual lab was 20-25.2 mg/L. Each of the values reported here were again lower than the ETS value, indicating some form of systemic error (if ETS is taken as a standard). Systemic errors that may lead to chronically low values for aeration oxidation might be low flow rate (lower flow rates result in lower overall values, even when adequate time is allotted5) or leaks in the tubing.
If winemakers were running 5 replicates each time, this range of averages would likely be acceptable for determination of SO2 addition. However, most winemakers test a given sample only once. The global range of values reported for the white wine sample was 10.8 – 26.6 while the global range for the red wine samples was 16.7 – 33.3. Each winemaker must decide for themselves how much variation is acceptable when making decisions, but a standard deviation above 3 indicates a 12 mg/L spread of values to account for 95% of the variation. This makes determination of additions difficult.
Within-lab precision varied based on the experience of the experimenter. Experimenter 1 self-reports as having high confidence and frequent experience with the aeration oxidation method. Results from this experimenter are very precise with a tight range of values reported (Figures 1&2, Table 2). Experimenters 2 & 3 have less experience and confidence with this method. Their results show less repeatability and wider range of values. For example, with a standard deviation of 3.4, Experimenter 2 would have values within 6.8 mg/L of the mean only 68% of the time while 95% of the time his value would be within 14.6 mg/L. This makes it difficult to determine how much, if any, SO2 should be added. This variation may diminish if the experimenter adopts aeration oxidation and uses it frequently. However, after early adoption, it may be useful to run replicate samples until this range of values diminishes.
Round 2
Global averages for the white wine were 3.4 mg/L (17.9%)(AO) and 2.68 mg/L (14.1%) (Hanna) less than the ETS value, while the global averages for the red wine were 7.44 mg/L (31%) (AO) and 7.85 mg/L (32.7%) (Hanna) less than the ETS value. If the ETS value is taken as the standard, this is not good accuracy. Systemic errors should be investigated.
Overall precision was better for the red wine samples than the white wine samples, with global standard deviations less than 1.5 for each red wine technique but 3.93 (AO) and 8.90 (Hanna) for the white wine samples. When comparing the two techniques, aeration oxidation reported values with more precision on the white wine than the Hanna titrator, but the results from the red wine was comparable. This may be due to order effects, as experimenters gained experience with the titrator they may have improved precision. It may also be due to the wine matrix itself. Different types of wines have different error rates in standardized testing1,6. This may be further complicated by experimenter experience.
Experimenters 1 and 2 experienced very high variation with the Hanna titrator when processing the white wine, leading to high overall variation in this wine (Figure 3) however, this variation was not seen in the red wine (Figure 4), indicating the difficulty may be in operator experience rather than inherent to the method. Experimenter 3 has more experience with the Hanna titrator, and reported results with very high precision (SD = 0.3 and 0.14) for both wines. Experimenter proficiency with one technique does not always translate to proficiency with another. Experimenters 1 and 3 show high precision with one technique but low precision with the other (Figure 3), and both improved by the end of the second round, when precision was acceptable for all experimenter using both methods.
All of the aeration oxidation data reported here were calculated from the corrected value based on standardization of NaOH solution prior to running the test. The range of correction needed was -1.5 to +1.3 through all tests in all rounds. This is within the margin of error for any individual test. As long as the NaOH solution lies within the acceptable range (0.0095-0.0105 N), correction is not necessary.
Costs
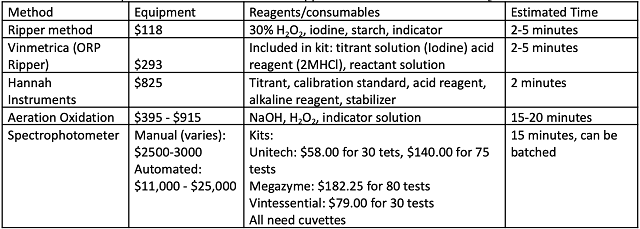
When considering which method best fits into a winery’s quality control plan, several costs should be considered including startup costs, cost per test, and personnel time (Table 4). At the time of this writing, a simple aeration oxidation apparatus including all glassware and measuring devices cost under $400 (Carolina Wine Supply). This apparatus does not also test total SO2. An aeration oxidation apparatus that also tests total SO2 can be purchased for just over $900. Aeration oxidation reagents are very inexpensive, but the technique requires some technician training as well as 15 minutes of running time. Running time is passive, so the operator can multi-task during this time. The Hanna titrator cost $825 at the time of this writing. It also came with measuring devices. To run each test, pre-packaged consumables are used, averaging to $1 per test7. Tests are complete in minutes, requiring less operator time.
Preliminary conclusions and next steps
-
Neither technique had consistently acceptable accuracy when compared to ETS as a standard, with each reporting averages less than the ETS value. The effect was more pronounced in Round 2, especially with the red wine. Sources of systemic error should be investigated. Most likely sources of error for aeration oxidation would be flow rate for air pump as well as ensuring no leaks in tubing lines and secure seals during operation.
-
Lack of experience with a give technique can lead to large ranges in single readings. But precision improves with experience. If using a new technique or introducing a new piece of equipment, it is recommended to run replicate samples to understand the range of potential values when making decisions. With experience, it is expected that the range will narrow and replicates may be eliminated once the winemaker is comfortable with the range.
-
Periodic testing for accuracy (comparison to a trusted service lab) and precision is recommended as part of a quality control program.
-
Even experienced operators occasionally have aberrant data points. If running a single test, this rogue data point may lead to regrettable SO2 additions. Referring back to records of previous SO2 values for a given wine may help identify which tests should be re-run. Familiarity with “normal” values will also help.
-
Both AO and Hanna titration are capable of acceptable precision with proper training, calibration, and experience.
Report References
(1) Butzke, C. E.; Ebeler, S. E. Survey of Analytical Methods and Winery Laboratory Proficiency. American Journal of Enology and Viticulture 1999, 50 (4), 461–465.
(2) Collaborative Testing Services, Inc. Wine Industry Interlaboratory Program Summary Report #065 - Summer 2020; Collaborative Testing Services: Sterling, Virginia, 2020.
(3) Iland, P.; Bruer, N.; Edwards, G.; Weeks, S.; Wilkes, E. Chemical Analysis of Grapes and Wine; Patrick Iland Wine Promotions PTY LTD: Campbelltown, Australia, 2004.
(4) Wilkes, E. Practical Measurement of Total SO2 in Wine. Wine and Viticulture Journal 2018, Spring, 3.
(5) Buechsenstein, J. W.; Ough, C. S. SO2 Determination by Aeration-Oxidation: A Comparison with Ripper. 1978, 29 (3), 4.
(6) Howe, P. A.; Ebeler, S. E.; Sacks, G. L. Review of Thirteen Years of CTS Winery Laboratory Collaborative Data. American Journal of Enology and Viticulture 2015, 66 (3), 321–339. https://doi.org/10.5344/ajev.2015.14119.
(7) Jacobson, J. Wine Analysis for Small Scale Wineries. Wine Business Monthly 2009, No. July, 1.
Figure 1: Comparison of free SO2 values generated for a white wine sample (Franzia Refreshing White) by aeration oxidation for three researchers in Round 1 of testing.
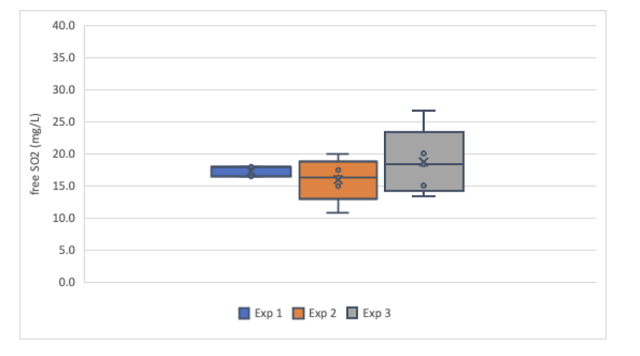
Figure 2: Comparison of free SO2 values generated for a red wine sample (Franzia Merlot) by aeration oxidation for three researchers in Round 1 of testing.
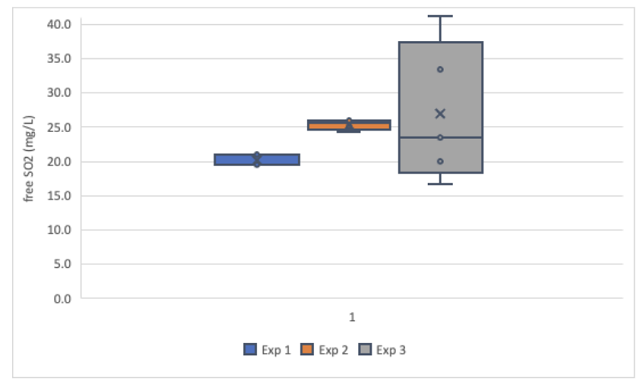
Table 2: Comparative statistics for round one of free SO2 testing of two wines using aeration oxidation
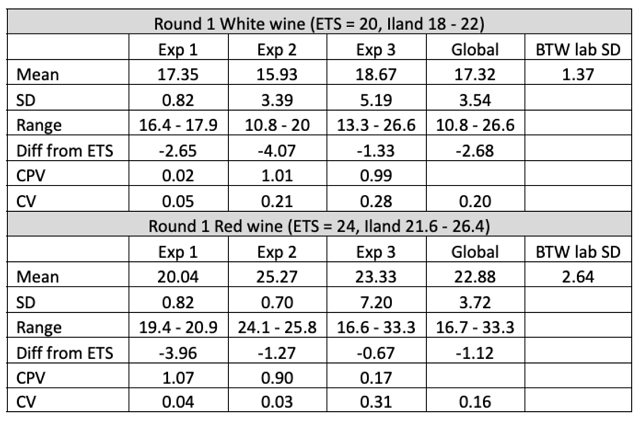
Figure 3: Comparison of free SO2 values generated for a white wine sample (Franzia Refreshing White) by aeration oxidation and Hanna titration for three researchers in Round 2 of testing.
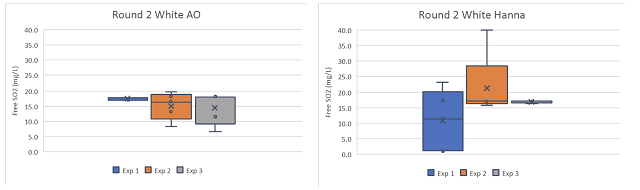
Figure 4 :Comparison of free SO2 values generated for a red wine sample (Franzia Merlot) by aeration oxidation and Hanna titration for three researchers in Round 2 of testing.
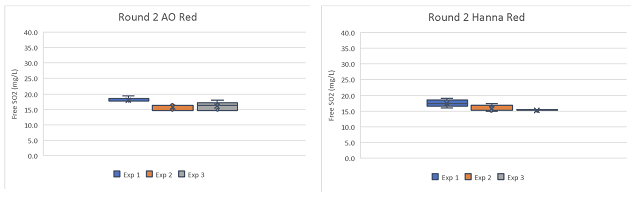
Table 3: comparative statistics for round two of free SO2 testing of two wines using aeration oxidation and Hanna titration
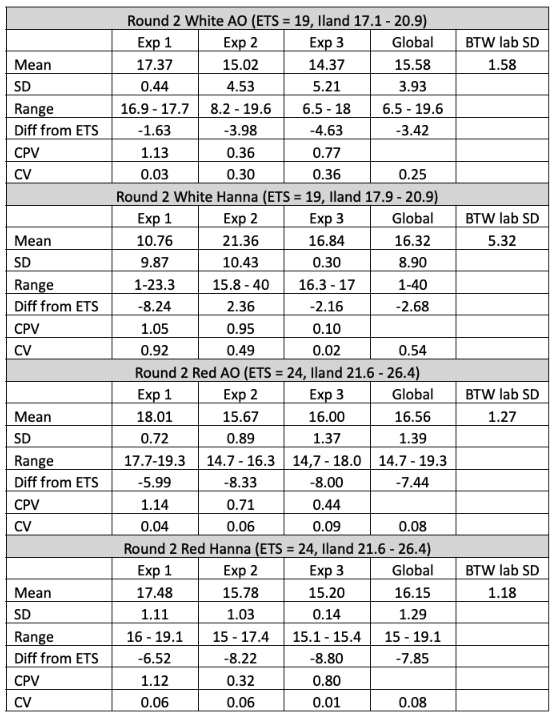
Table 4: Comparative cost of materials and supplies for various methods of SO2 determination
Appendix A: Determining free SO2 using the aeration oxidation method
Prior to starting
-
Set up the apparatus according to the instructions given by the manufacturer. Figure 1 gives one example. Check to make sure all tubing is securely fastened with no air leaking from the attachments. Turn on the air pump and check that the flow rate is about 1 liter per minute.
-
Ensure all glassware is clean, dry, and free of residue. Extra caution can be taken by rinsing glassware with reagents prior to use.
-
Wine should be collected the same day as SO2 determination and stored in inert containers filled to the top with an airtight closure.
-
Prepare the dilute (0.3%) hydrogen peroxide solution fresh every day, as it is unstable in this form. If you are using a 30% stock solution, you can use a volumetric glass pipette or micropipette and a volumetric flask to dilute the 30% stock solution 1/100 with distilled water. Rinse the volumetric pipette with a little bit of 30% peroxide before using, then discard into the sink. Preparation of 100 mL will give you enough peroxide to do 10 tests. If you are using 3% peroxide, you can dilute 10/100 or mix each batch individual (1/10). Be careful with high percentages of peroxide. It is best to use gloves when working with 30% peroxide. Store the hydrogen peroxide stock solution in the refrigerator.
Vacuum Aspiration
-
Prepare the burette for titration. Fill a 25 mL burette (with 0.1 mL markings) with 0.01N NaOH* solution. This solution should be filled fresh every day. After filling the burette, place a small beaker underneath the burette and open the stopcock until any bubbles between the stopcock and the end of the burette have been flushed out, then close the stopcock.
-
Remove the bottom of the impinger set (flat-bottomed cylindrical flask) from the upper clamp of the AO apparatus. Combine the following in the cylindrical flask (bottom of the impinger set):
10mL 0.3% H2O2
2-3 drops indicator solution
This mixture should be olive or turquoise green. If the solution is not green, add one drop of NaOH at a time from the burette until the solution turns green. Alternatively, rinse/clean everything and start over.
-
Clamp the impinger bottom to the metal rod with the upper clamp then insert the impinger top into the impinger bottom. Ensure a secure closure.
-
Remove the round bottomed double neck flask from the lower clamp. Use a volumetric pipette to add 20 mL wine, then use a transfer pipette to add 10mL 25% H2PO4. Re-attach the flask to the lower portion of the AO apparatus. Attach the stopper to the lower flasks, making sure there is a good seal.
-
Turn on the air flow (water flow, vacuum or bubbler). Check to make sure the liquid in the round bottomed flask is being agitated and airflow is 1-1.5 liter per minute. If there is no agitation or if the flow rate is too low, check all stoppers to make sure they are sealed. The solution in the glass cylinder should turn magenta/purple within the first couple of minutes. If this solution does not change color, either the SO2 is so low so as to be undetectable or an error has been made in adding solutions. Set a timer and aerate for 15 minutes.
-
After 15 minutes, turn off the air flow, remove the upper impinger from the lower impinger and remove the lower impinger from the clamp. Record the initial volume of 0.01 N NaOH in the burette to one decimal place. Slowly dispense 0.01 N NaOH into the flat bottomed cylindrical flask with gentle agitation until the solution turns olive green. The solution should turn from magenta to gray, then green with the next drop. Stop the flow of 0.01N NaOH as soon as the solution turns green. If the solution proceeds past olive green to bright green you have gone too far (Figure 2). Record the final volume of NaOH in the burette. Subtract the final volume from the initial volume to determine the volume of NaOH used. Multiply the change in volume by 16 to determine mg/L (ppm) of free SO2.
*Keep the stock solution of 0.01 N NaOH in the refrigerator. Replace the solution in the burette daily. Check the concentration each week using the protocol found in “regent standardization”.
Figure 1: Aeration oxidation assembly set-up for free SO2.
From: www.piwine.com/aeration-oxidation-apparatus-free-SO2.html
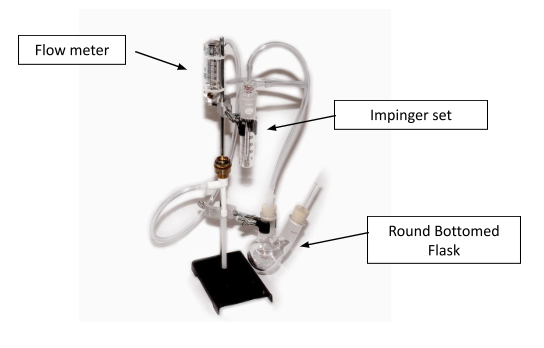
Figure 2: Sequence of color change during NaOH titration
(photo credits: AJ Greeley, Phil Fassieux)
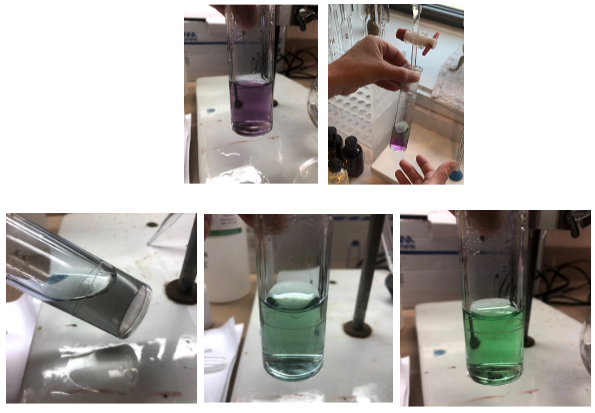
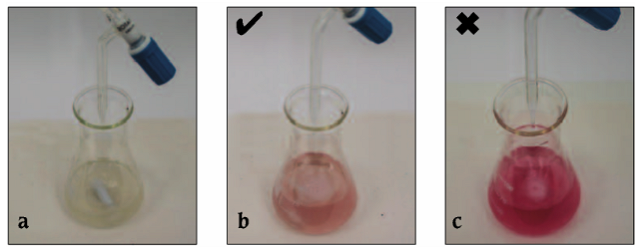
Figure 3: Guide to the color change for reagent standardization with phenolphthalein. (a) at the beginning (b) at the end point (c) when over titrated (from Iland 2004)
NaOH Standardization
Stock solution of 0.01 N NaOH should be standardized every time a new batch is made from pellets or when a new bottle is opened, then once per week afterward. This solution should be stored in the refrigerator between uses to minimize breakdown.
Procedure: Pipette 5mL of 0.02 N H2SO4 into a 250 Erlenmeyer flask. Add a few drops of 1% phenolphthalein. Titrate to a light pink endpoint with 0.01 N NaOH. When you are getting close, you will see a bit of pink that will disappear with swirling. Keep adding NaOH until the first drop that the pink persists. This is usually about 1 mL or so after the first appearance of pink.
Store the 0.02 N H2SO4 and phenolphthalein in the refrigerator. They should be good for several years.
Calculation: (0.02N)(5mL H2SO4)/mLs of NaOH used = N of NaOH
Parameters: 0.0085-0.0105 N
*0.1 NaOH can be prepared by dissolving 2g reagent grade NaOH in distilled water to reach 500 mL in a volumetric flask
Appendix References
Iland, Patrick, Nick Bruer, Greg Edwards, Sue Weeks, and Eric Wilkes. Chemical Analysis of Grapes and Wine. Campbelltown, Australia: Patrick Iland Wine Promotions PTY LTD, 2004.
Presque Isle Wine Cellars. “Testing For Free (Unbound) Sulfur Dioxide In Wine Using The Aeration Oxidation Method,” n.d. http://www.piwine.com/media/home-wine-making-basics/testing_free_s02_by_aeration_oxidation.pdf.
Zoecklein, Bruce, Kenneth C. Fugelsang, Barry H. Gump, and Fred S. Nury. Wine Analysis and Production. New York: Springer, 1995.