Accuracy and precision of free SO2 testing methods
Joy Ting
January 2022
The most common question asked about SO2 methodology is some variation of “which is the best one” or “which one should I be using”? In a perfect world, we all want a method that is accurate, precise, robust, and inexpensive. However, the real answer depends on how much SO2 testing you are doing, how much time and resources you have to devote to the pursuit, and how accurate you need the results to be to make a good decision. Whichever method you choose to implement in your winery, you should always validate the method both at the beginning of use and periodically throughout its usage to ensure you have set things up correctly and nothing has changed after implementation. Even slight modifications to the way a method is applied in a winery can lead to significant changes in outcomes1.
Which method is the most precise?
As winemakers we are most concerned with the accuracy (the difference between the measured value and the true value) and precision (how well our methodology will produce the same result when performed multiple times)1 of a testing method. For free SO2 analysis, it is difficult to determine accuracy because many variables in the wine matrix affect how much SO2 is bound vs. free, making it very difficult to prepare standards. Instead, comparison to a mean is often used as a benchmark. But beware, if systematic errors exist, like poorly calibrated equipment or inherent biases in the test, the mean can be far from accurate (see the next section on headspace detection methods for molecular SO2 for a good example). Precision is easier to determine. One often-used measure of precision is the confidence interval (CV), which indicates the range within which the true value of the analysis is thought to fall given the imprecision in repeated testing. CV is calculated by dividing the standard deviation of a group of readings by the mean of that same group2. Each of the testing strategies outlined in the previous section (Ripper, aeration oxidation, spectrophotometric) have, to one degree or another, have been developed with the goals of accuracy and precision in mind. However, when tested in research laboratories and in wineries, determination of free SO2 has been shown to have some challenges.
There are a few reports of side by side testing of free SO2 testing methods. Buechsenstein and Ough (1978)3compared Ripper and aeration oxidation values for four wines (two reds, two whites) that had been spiked with 50 mg/L, 100 mg/L and 150 mg/L SO2. They report higher variation in Ripper (CV of 9.5%) than aeration oxidation (CV of 2.6%). In one Pinot Noir, the range of values found for AO was 61.8 – 64.5 mg/L while the range for Ripper was 51.2 – 60.8 mg/L. In an internal Unitech study of their spectrophotometric method, Geoff Anderson (n.d) tested 13 Chardonnays and 12 red wines and found Ripper accuracy to be +/- 5ppm while aeration oxidation accuracy was +/- 2ppm with AO results typically 7ppm lower than Ripper4. All spectrophotometric analyses yielded values within 7ppm of traditional values with differences depending on the wine and method. All Chardonnay samples were with 1.5 ppm of Ripper while spectrophotometric methods averaged 5-7 ppm higher in red wines. It is important to note these tests were done on an automated spectrophotometer, minimizing human error in pipetting. It is expected these rates would be higher using the same kits on a manual spectrophotometer.
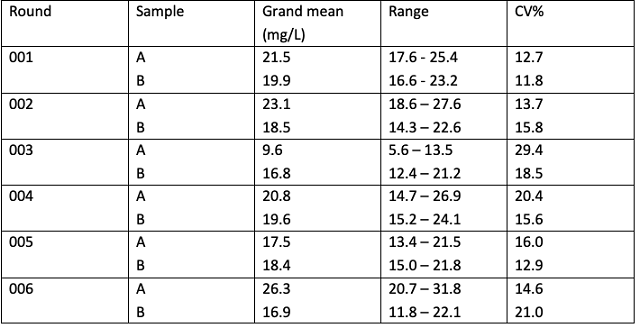
Results of precision testing from research laboratories may differ from the precision reached in production wineries due to differences in quality control protocols. In 1988, the ASEV Technical Projects Committee undertook an effort to encourage implementation of quality standards in the American wine laboratory testing through proficiency testing1 that eventually grew into a program run through the Collaborative Testing Services (CTS)5(https://collaborative-testing.com). Participating wineries received two bottled sample wines every 4 months to analyze in-house with as many replications as they chose. Resulting values were reported to the testing agency and compared within and between labs. Participants fell into three categories: formally accredited labs with quality control systems in place, laboratories with few quality control systems in place, and those with neither training, experience, nor knowledge of laboratory quality systems. For free SO2, accuracy is difficult to measure because the amount of free vs. bound SO2 is often changing, so results were compared to the grand mean of all reported results1,5,6. In a review of progress from 2002, Butzke (2002) reported variation in free SO2 values ranging from 11.8 – 29.4% depending on the wine tested, which could mean ranges as narrow as 16.6 – 23.2 but as wide as 11.8 – 22.1 mg/L (Table 1). In a report on 13 years of collaborative data from this program, including participation from 30-77 participants per cycle, free SO2 testing in general was shown to have a within-lab variation (CV) of 5.4% but across lab variation of 19.4%. These data included all methodologies, with 44% of participants reporting using aeration oxidation, 27% reporting using Ripper, and 6.4% reporting a colormetric method (the remainder were using segmented flow, flow injection, and enzymatic methods). In general, Ripper values were 2.7 mg/L higher than those reported from aeration oxidation methods (likely due to binding of non-SO2 components of the wine matrix). At the outset of this program, Butzke and Ebeler (1998) set a goal of 1% CV for each test. At each reporting, variation for free SO2 values was considerably higher5,6, and additional measures of quality control were suggested.
How to validate a method and test proficiency in your winery
No matter which method you choose, it is important to understand the limitations of the approach and validate that method when it is first implemented as well as periodically check back to ensure it is being performed properly. The process of validation will allow you to identify and rectify sources of error as well as better understand how to interpret the values you generate. Unfortunately, many of the usual methods of validation are not applicable to free SO2 testing. Standard solutions are difficult to make and degrade quickly, and spiking a wine with a known amount of SO2 will not result in a commensurate increase in free SO2, as some (unknown) portion will be bound up1,2. Following are some approaches to determine if the free SO2determination method you choose is being performed properly:
- SO2 standard solutions can be carefully prepared from potassium metabisulfite2. Iland et al (2004) recommend preparing a stock solution of 10 g/L SO2 (using 75 g of reagent grade potassium metabisulfite dissolved in NaOH and diluted in water). The stock solution can then be diluted to working solutions of 20 mg/L, 50 mg/L and 100 mg/L. Testing replicates of 20 mg/L solution should recover no more than 10% variation (with results from 18-22 mg/L). Testing of each will produce a standardization curve, which should be linear.
- Analyze a number of samples in tandem with a trusted service lab1. Send topped, sealed bottles in glass (plastic allows oxygen to permeate which may change free SO2 values) to a trusted service lab, then run the same samples in-house on the day the lab receives them. Do at least three, and up to seven. From the results, you can calculate your accuracy relative to the service lab.
- To determine precision, run the same sample seven times2. Calculate the mean and standard deviation (Excel has a function for this). Divide the standard deviation by the mean to determine the %CV. A value of 10% or less is generally acceptable for winery decision making2. (For a value of 20 mg/L, this would equal a range of 18-22 mg/L.) Keep in mind precision depends on the type of wine, so repeat this procedure with red, white, and sweet wines.
- Repeat #2 on a different day to get an idea of how robust your method is to routine differences. If multiple people run free SO2 in your winery, test proficiency in each to identify differences and potential errors.
If the resulting values are unacceptably imprecise or not close enough to the service lab values, there are several questions to ask. First, are your values always higher or always lower? This could point to a systematic error, such as improperly calibrated equipment (for example, the flow rate on the AO is too high or too low) or poorly standardized solutions (0.01 M NaOH is really 0.0093 M), as well as consistent errors in endpoint determination (over-titrating will lead to consistently higher numbers). If variation is too high, perhaps more practice is needed with pipetting or titrating.
Table 1: freeSO2 values reported from ASEV Laboratory Proficiency Testing from 1998-2001 (reproduced from Butzke 2002)
References
(1) Butzke, C. E.; Ebeler, S. E. Survey of Analytical Methods and Winery Laboratory Proficiency. American Journal of Enology and Viticulture 1999, 50 (4), 461–465.
(2) Iland, P.; Bruer, N.; Edwards, G.; Weeks, S.; Wilkes, E. Chemical Analysis of Grapes and Wine; Patrick Iland Wine Promotions PTY LTD: Campbelltown, Australia, 2004.
(3) Buechsenstein, J. W.; Ough, C. S. SO2 Determination by Aeration-Oxidation: A Comparison with Ripper. 1978, 29 (3), 4.
(4) Anderson, G. Free & Total Sulfur Dioxide Measurement. 9.
(5) Howe, P. A.; Ebeler, S. E.; Sacks, G. L. Review of Thirteen Years of CTS Winery Laboratory Collaborative Data. American Journal of Enology and Viticulture 2015, 66 (3), 321–339.
(6) Butzke, C. E. 2000/2001 Survey of Winery Laboratory Proficiency. 2002, 7.