The Impact of Increased Sulfur Dioxide at Crush on Color and Tannin Extraction (2017)
Scott Dwyer, Melaney Schmidt, and Russell Moss
Chemeketa Cellars
Summary and Introduction
High concentrations of sulfur dioxide at crush can enhance color extraction during maceration. This study examines the impact of high levels of sulfur dioxide at crush on color and phenolic extraction. Pinot noir from a single vineyard block was sorted, destemmed, and divided into 4 T bins. The T bins received either 50ppm, 100ppm, 150ppm, or 200ppm sulfur dioxide at crush. All other treatments between wines were identical. 150ppm and 200ppm sulfur dioxide seemed to induce a slightly longer lag phase relative to lower levels of sulfur dioxide, but otherwise fermentation kinetics were similar. Wine chemistry was similar between treatments, except that TA and lactic acid decreased slightly with increasing levels of sulfur dioxide. Total, free, and molecular sulfur dioxide increased with increasing concentrations added at crush. Color intensity, anthocyanins, catechin, epicatechin, and tannin all seemed to increase as well from increasing sulfur dioxide usage. Overall, lower rates of sulfur dioxide tended to have higher Fruit Intensity. 100ppm of sulfur dioxide had a strong tendency for the highest Fruit Intensity and lowest Herbaceous/Green character. Body tended to be higher at 100ppm as well. Higher rates of sulfur dioxide addition (above 100ppm) tended to increase Astringency. The perception of Acidity may have been increased by higher sulfur dioxide levels as well. The most preferred wine was the wine produced with 100ppm of sulfur dioxide. More studies should be performed to evaluate the use of sulfur dioxide at crush, particularly with other grape varieties.
Results and Discussion
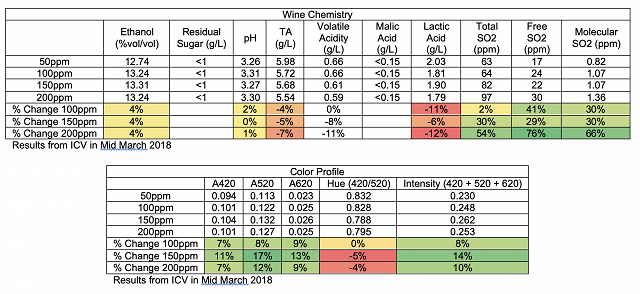
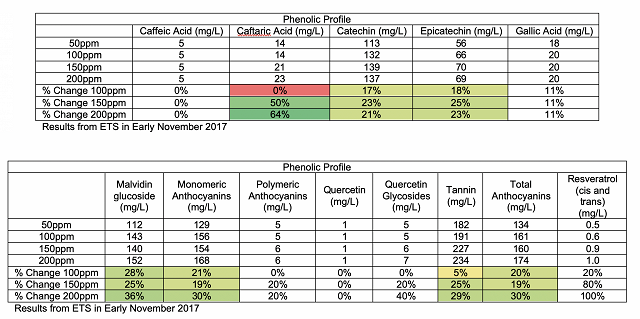
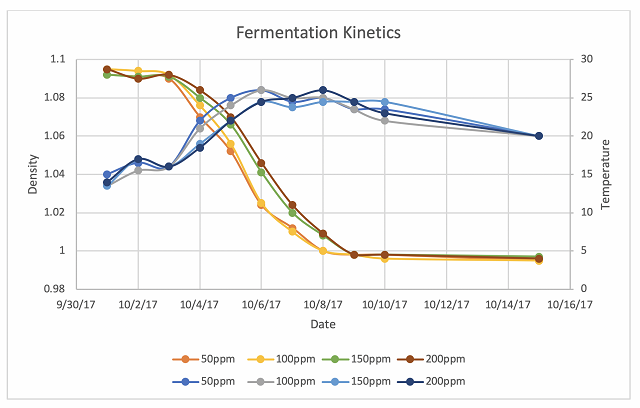
150ppm and 200ppm sulfur dioxide seemed to induce a slightly longer lag phase relative to lower levels of sulfur dioxide, but otherwise fermentation kinetics were similar. The control lot completed MLF (<0.10g/L malic acid) 10 days post-racking with a linear increase in completion time relative to sulfur dioxide concentration at crush thereafter up to 26 days. Wine chemistry was similar between treatments, except that TA and lactic acid decreased slightly with increasing levels of sulfur dioxide. Total, free, and molecular sulfur dioxide increased with increasing concentrations added at crush. The amount of bound sulfur dioxide tended to increase as well. Color intensity, anthocyanins, catechin, epicatechin, and tannin all seemed to increase from increasing sulfur dioxide usage. These results suggest that increased concentrations of sulfur added at crush could be used to increase anthocyanin and tannin concentration without preventing or significantly delaying alcoholic fermentation or malolactic conversion.
For the April 18 tasting, there was a strong trend for the 100ppm wine to have higher Fruit Intensity (LSD=0.87) and to have lower Herbaceous/Green character (LSD=0.88). There was a slight tendency for Body and Overall Aromatic Intensity to be higher in the 100ppm wine, for Overall Aromatic Intensity to be lower in the 200ppm wine, and for Astringency to be higher in the 150 and 200ppm wines. In general, the most preferred wine was the 100ppm wine, and the least preferred wine was generally the 150ppm wine.
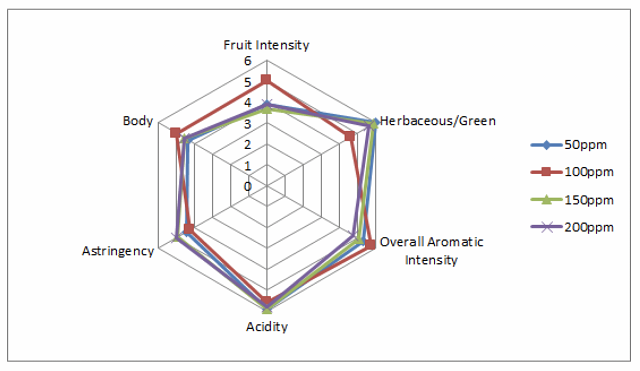
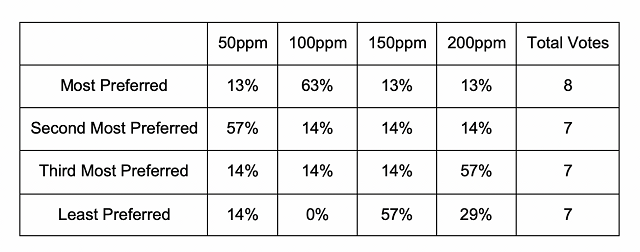
For the descriptive analysis on May 9, there were no strong trends for the descriptors used in this study. 200ppm sulfur dioxide tended to have higher Overall Aromatic Intensity and Astringency. Higher rates of sulfur dioxide tended to increase acidity, and perhaps increased Body as well. Lower rates of sulfur dioxide tended to have higher Fruit Intensity. Other results were mixed. In general, the 100ppm wine was most preferred, and the 50ppm tended to be least preferred.
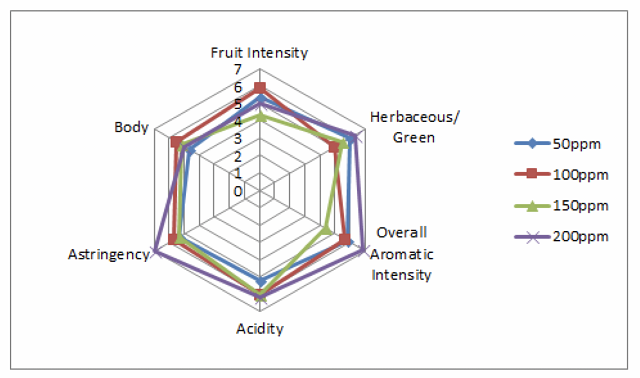
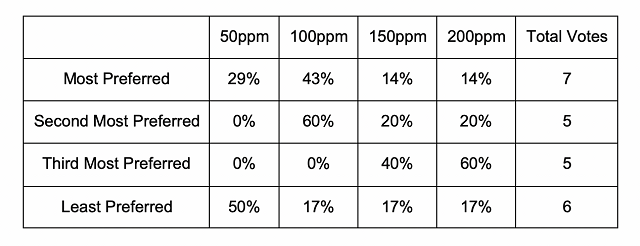
Overall, lower rates of sulfur dioxide tended to have higher Fruit Intensity. 100ppm of sulfur dioxide had a strong tendency for the highest Fruit Intensity and lowest Herbaceous/Green character. Body tended to be higher at 100ppm as well. Higher rates of sulfur dioxide addition (above 100ppm) tended to increase Astringency. The perception of Acidity may have been increased by higher sulfur dioxide levels as well. The most preferred wine was the wine produced with 100ppm of sulfur dioxide. More studies should be performed to evaluate the use of sulfur dioxide at crush, particularly with other grape varieties.
Methods
Pinot noir (Oregon) from a single vineyard block was sorted, destemmed, and divided into 4 equal 0.75 ton lots. All winemaking parameters between lots were identical with the exception of increasing rates of sulfur dioxide additions made prior to fermentation. Additions were made as a 5% (w/v) potassium metabisulfite solution using rates of 50 (control), 100, 150, and 200ppm respectively. Following alcoholic fermentation and prior to pressing, 228L free run juice from each lot was racked to 4 identical and neutral French oak barrels and inoculated with 1g/hL malolactic bacteria.
These wines were tasted on April 18 and May 9. In order to balance the data set to perform statistical analysis for descriptive analysis on the April 18 tasting, any judge who had not fully completed the descriptive analysis ratings were removed. In order to then make the number of judges between groups equivalent, one judge from group 2 was transferred to group 3. This resulted in a final data set of 3 groups, each with 3 judges (considered as replications within groups, and groups were considered as assessors). Data was analyzed using Panel Check V1.4.2. Because this is not a truly statistical set-up, any results which are found to be statistically significant (p<0.05) will be denoted as a “strong trend” or a “strong tendency,” as opposed to general trends or tendencies. The statistical significance here will ignore any other significant effects or interactions which may confound the results (such as a statistically significant interaction of Judge x Wine confounding a significant result from Wine alone). The descriptors used in this study were Fruit Intensity, Herbaceous/Green, Overall Aromatic Intensity, Acidity, Astringency, and Body.
The same procedures for data analysis were used on the May 9 tasting. For the descriptive analysis in this tasting, one judge was transferred from group one to group 2 so that each group had two judges, for a total of 6 judges.
