Exploring the sensory impact of juice turbidity in fermentation of Viognier (2024)
Boela Gerber, Jeremy Mersch, Jordan Kennedy
Southwest Mountain Vineyards
Summary
The level of juice turbidity can influence yeast health, fermentation kinetics, and aroma development in white wines. In this experiment, Viognier juice was adjusted to three turbidity levels (<100, 200, and 300 NTU) prior to fermentation. All treatments fermented to dryness with very similar final chemistry. Wines made from higher turbidity juice (300 NTU) showed lower concentrations of fruity and floral esters, consistent with the presence of esterase enzymes in juice solids, though differences were modest. In sensory analysis, there were no significant differences among treatments for fruit intensity, fruit character, palate volume, or reduction. The 100 NTU wine was perceived as less acidic than the others, despite no measurable chemical difference. Overall, varying juice turbidity within the tested range did not strongly impact fermentation performance or sensory outcomes in Viognier.
Introduction
Solids in grape juice play a crucial role in fermentation kinetics, yeast metabolism, and wine sensory attributes. Chemically, juice solids contain a mixture of polysaccharides (~70%), lipids, minerals, pectins, and nitrogenous compounds (including enzymes) (~2.5%), as well small amounts of phenolics1. The composition of juice solids varies significantly depending on grape origin and processing methods2. More than 40 volatile and non-volatile wine compounds are influenced by juice turbidity3. While most winemaking plans for white and Rosé wines include juice clarification, the extent of clarification varies, and can be important. Both excessive turbidity and over-clarification can lead to undesirable sensory characteristics in the wine.
Some amount of juice solids is needed for fermentation kinetics and completion. Lipids found in grape solids, particularly sterols like β-sitosterol, are critical for yeast cell membrane integrity in high sugar and high ethanol environments, so much so that they are referred to as “survival factors”2. While yeast can produce sterols in the presence of oxygen, fermentation is largely anaerobic, meaning yeast must rely on the environment to provide sterols. Sterols supplied through juice solids or enological additives can improve fermentation kinetics, reduce the risk of sluggish or stuck fermentations, and enhance yeast nitrogen assimilation2. Maintaining yeast health with adequate sterols also helps reduce yeast stress, lowering the production of acetic acid and acetaldehyde3. Additionally, higher juice solids contribute to increased polysaccharide and glycerol content, enhancing texture and mouthfeel1,3.
While it is beneficial to have some solids, excessive amounts can cause problems. Juice solids contain polyphenol oxidase (PPO) enzymes, which promote oxidation, leading to juice browning and the degradation of aromatic compounds like thiols1,2. Solids also contain esterase enzymes that can reduce fruity ester concentrations, diminishing varietal character in the wine2,3. If sulfur-containing sprays were used in the vineyard, residual sulfur compounds on solids can be reduced during fermentation to form hydrogen sulfide (H₂S) and other undesirable reductive aromas in the wine1. High solids levels are also linked to increased hexanol and other C6 compounds, which can impart herbal or green aromas3.
Juice turbidity is most commonly measured in NTU (nephelometric turbidity units), using a nephelometer. These instruments are relatively accessible (approximately $1,000) and provide a quick, quantitative benchmark to guide winemaking decisions. However, NTU is an imperfect measurement, as it does not directly indicate the quantity or composition of juice solids. Due to variations in particle size, the same NTU reading can represent very different solid compositions depending on grape variety, processing methods, and juice handling2. In addition, sterol and lipid concentrations, vary widely among grape types, meaning turbidity does not necessarily correlate with sterol availability2.
When measuring NTU’s, general guidelines suggest maintaining juice turbidity between 50-150 NTU to balance yeast nutrition and wine aroma development1,2. Within this range, different turbidity level may contribute to elements of wine style, though the impact may be subtle. For example, Niccolini et al (2011)3 found larger differences in the aromatic composition of wines based on yeast strains than on turbidity level. In recent catalogues, Scottlabs has included turbidity level as one of the many elements in their style guides for Sauvignon Blanc, Chardonnay and Aromatic White Wines. In these guides, NTU’s range from 60-120 NTU. Casalta et al (2019) found the optimal turbidity for maximizing fruity aromas in Chardonnay and Pinot Gris was just below 100 NTU, with slightly higher levels contributing to increased complexity2. In cases where juice solids are low, oxygenation at the end of yeast growth may help compensate for lipid deficiency1,2.
In Virginia, some winemakers clarify juice to very low NTU using enzymes and very cold temperatures while others prefer not to use enzymes, resulting in more turbid juice. (Bentonite can also be used at juice settling to help clarify juice.) Previous work by Boela Gerber observed a correlation between high turbidity and increased reductive characteristics during fermentation. However, this was not the case all of the time. The purpose of this experiment was to compare the fermentation kinetics, wine chemistry and sensory properties of Viognier when fermented at three levels of juice turbidity (<100, 200, and 200 NTU).
Methods
Fruit was hand harvested, chilled overnight, then pressed to tank with the addition of 50 ppm SO2 and 2 g/hL Lafazyme CL. After settling, wine was racked to a separate tank, then transferred to barrels for fermentation. After transfer, juice lees were added back to each barrel to achieve the target turbidity for each treatment level (< 100, 200, and 300 NTU). Two barrels were prepared for each treatment. Turbidity was measured for each barrel post adjustment. All other operations and additions were the same among the barrels.
Juice was inoculated with 25 g/hL Zymaflore X16. Brix and temperature were measured daily for each barrel. After the beginning of fermentation, 1 g/L tartaric acid was added to each barrel. Fermaid O (20g/hL) and DAP (20 g/hL) were added after a few Brix depletion. Thiazote PH (30 g/hL) was added the following day. After all sugar had been consumed (glucose/fructose equal to 0.1 g/L), 30 g/hL Stab Mirco M was added to each barrel. Three days later, 60 ppm SO2 was added.
Sensory analysis was completed by a panel of 31 wine producers. Wines were presented blind in randomly numbered glasses. To account for order effects, there were four tasting groups with wines presented in different order for each group. Tasters were asked to score each wine on a scale of 0 to 10 for fruit intensity, fruit character, palate volume, perception of acidity, and reduction. They were also given open ended questions to describe the wines. Descriptive scores were analyzed using repeated measures ANOVA.
Results
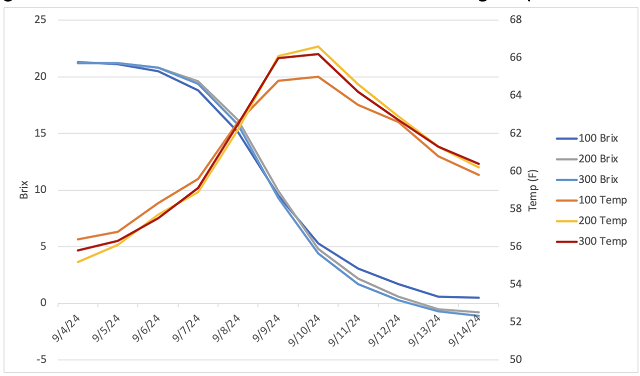
Fruit was harvested with chemistry value indicative of healthy, ripe Viognier (Table 1). Adding lees did not lead to a notable increase in measurable YAN. In each treatment, fermentation progressed in a roust manner with Brix depletion very similar among treatments until the fermentation reached about 5°Brix. At that time, the wine with 100 NTU slowed down sooner than the other treatments (Figure 1). Juice with lower turbidity may have fewer available sterols and, therefore, struggle when sugar is low and ethanol is high. All three fermentations fully completed fermentation, with glucose/fructose of 0.1 g/L by 9/22/25.
Table 1: Viognier juice chemistry (in-house values)

Table 2: Wine chemistry for three treatments of Viognier (ICV Labs Oct 31, 2024)
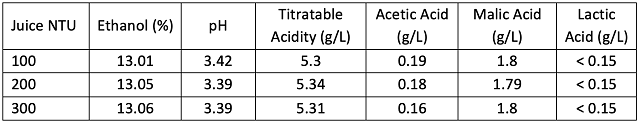
Figure 1: Fermentation kinetics for three treatments of Viognier (in-house data)
The wine finished fermentation with very similar chemistry (Table 2). Color metrics and SO2 concentration were also very similar among treatments (data not shown).
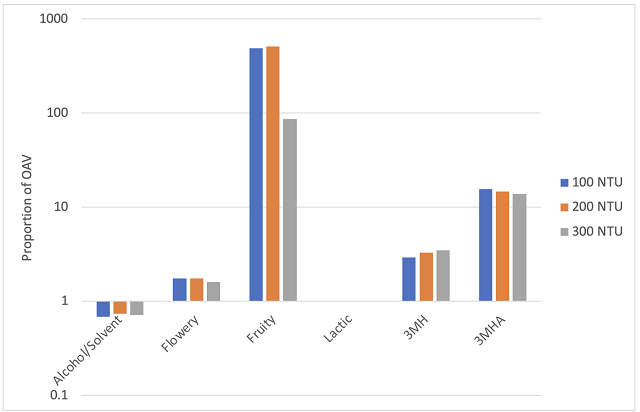
To assess aromatic differences between treatments, 14 esters and acetates were measured. These compounds were grouped into odor active vectors according to Ferreira et al (2022)4 and represented relative to their sensory thresholds, with an odor active value < 1 representing subthreshold levels (Figure 2). For all groups, the alcohol/solvent vector was below threshold. The wine made from juice with 300 NTU had lower concentration of flowery and fruity esters and acetates. This finding is consistent with the idea that juice solids contain esterase enzymes that can degrade fruity esters. This wine also had the highest 3MH but lowest 3MHA, indicating turbidity did not drastically change the aromatic compounds, but may have shifted their balance.
In a sensory analysis comparing Viognier wines made with different juice turbidity levels (100, 200, and 300), there were no significant differences in scores for fruit intensity, fruit character, palate volume, or reduction. The wine made with 100 NTU was perceived as being less acidic than the other two wines (p=0.03). In comparing the wines to one another using Tukey’s test and relaxing the p value restriction to <0.10, there was a significant difference between 100 v 200 and 100 v 300 wines in perception of acidity (p=0.09 and 0.07, respectively). Chemically, there was no difference in acidity, so this perception may have been impacted by other factors. Open ended questions indicated that some winemakers felt the 300 NTU wine was the most reductive of the treatments, however there was not statistically significant difference in scores for reduction.
Figure 2: Proportion of the odor activity value for esters, acetates, and thiols (NSEOS Lab). Esters and acetates have been grouped into aroma vector groups.
References
(1) Godden, P. Grape Solids in White Winemaking. Grapegrower and Winemaker 2019, No. 671.
(2) Casalta, E.; Salmon, J.-M.; Picou, C.; Sablayrolles, J.-M. Grape Solids: Lipid Composition and Role during Alcoholic Fermentation under Enological Conditions. Am J Enol Vitic. 2019, 70.
(3) Nicolini, G.; Moser, S.; Román, T.; Mazzi, E.; Larcher, R. Effect of Juice Turbidity on Fermentative Volatile Compounds in White Wines.
(4) Ferreira, V.; De La Fuente, A.; Sáenz-Navajas, M. P. Wine Aroma Vectors and Sensory Attributes. In Managing Wine Quality; Elsevier, 2022; pp 3–39.
Previous WRE experiments exploring turbidity
|
Experiment |
Variety |
NTU range |
Sensory |
|
Chardonnay |
110-225 |
Not different |
|
|
Sauvignon Blanc |
50-250 |
Different |
|
|
Sauvignon Blanc |
66 - 195 |
Different |