The Effect of Juice Turbidity on Aroma Development in Chardonnay (2016)
Corry Craighill
Sunset Hills Vineyard
Summary
This study compares the effects of fermenting Chardonnay juice at a low turbidity, medium turbidity (110NTU), and high turbidity (225 NTU). Juice from the same pick of Chardonnay was settled and racked into barrels. Turbidity was adjusted by adding back fine lees to the juice. All other treatments between wines were the same. The 110 NTU and 225 NTU wines had no chemical differences. The wines were not found to be statistically different at tastings, and those who were able to correctly distinguish the wines had a slight tendency to prefer the wine made from higher turbidity. This wine had a slight trend to be higher in Overall Aromatic Intensity and lower in Bitterness. More work is needed here to obtain a better understanding of the effect of juice turbidity on wine quality. It may be that the turbidity difference in this study was too small to have a great effect on the wine flavor profile.
Introduction
Differing levels of juice turbidity from grape particulates is thought to help improve fermentation performance through yeast nucleation, toxin nucleation, and release of more nitrogen compounds. Sustained contact of grape particulates with juice results in greater extraction of grape aroma compounds and precursors. However, high turbidity juices often result in reductive qualities occurring during fermentation, which can lead to difficulties while preparing the finished wine. There is great potential, however, for the style of certain wines to be greatly impacted by the level of turbidity alone in juice. This study examines the impact of medium and high juice turbidity on the chemistry and sensory characteristics of Chardonnay wine.
Results and Discussion
The 110 NTU and 225 NTU wines had no chemical differences.

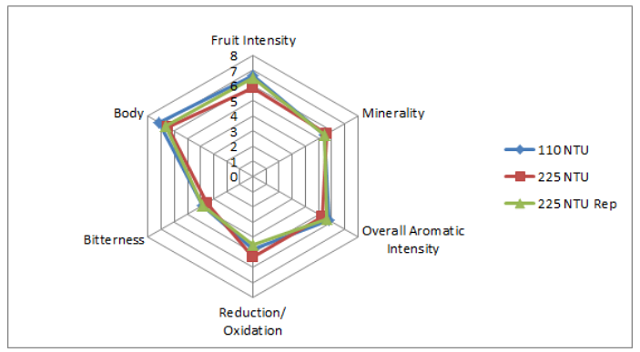
For the February 15 tasting, of 9 people who answered, 4 people chose the correct wine (44%), suggesting the wines were not significantly different. In general, people who answered correctly (2) preferred the wine made from 110 NTU turbidity, but this cannot be verified with the low amount of judges. Descriptive analysis did not reveal any strong trends for the wines.

For the March 8 tasting, 6 out of 29 judges (21%) distinguished the correct wine, indicating that the wines were not significantly different. Of those that were able to distinguish the correct wine, most preferred the wine made from high turbidity juice, although the number of judges who answered this was very small.

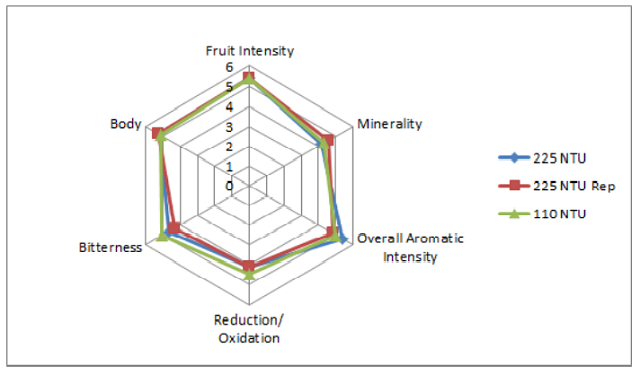
For the descriptive analysis on March 8, no strong trends could be found for the descriptors used in this study. However, the 225 NTU juice had a slight tendency to produce a wine with higher Overall Aromatic Intensity and lower Bitterness.

These results are inconclusive, and more work is needed to determine whether this difference in juice turbidity produces differences in wine. It may be that the turbidity difference was too small to have a great effect on the wine flavor profile.
Methods
One lot of Chardonnay from vineyard V1 was hand picked on 9/17 and whole cluster pressed on 9/18, with 20ppm sulfur dioxide and 15mL/ton CinnFree added. The juice fraction was cut at 1.7 bar, with the hardpress and first fraction being separate. The juice settled for 1 day at 7°C. The juice was then racked to another tank on 9/20 where the pH was adjusted to 3.5 with tartaric acid (0.5g/L). From there, the juice was racked to three identical, neutral barrels. Each barrel was racked to an initial NTU of 12. Clean lees were then added back to the next two trial barrels to reach a turbidity of 110 and 225. Barrels were inoculated with 15g/hL D47. 25g/hL Fermaid O were added on 9/23, 20g/hL Fermaid K were added on 9/26, and 20g/hL Fermaid K were added again on 9/27. Barrels were topped on 10/3. Once alcoholic fermentation was complete, 50ppm of sulfur dioxide was added to each barrel (10/19). 50ppm sulfur dioxide was added again on 11/23. Each barrel was stirred once per week for 4 months.
This project was tasted on February 15 and March 8. For the triangle test and preference analysis, anybody who did not answer the form were removed from consideration for both triangle, degree of difference, and preference. Additionally, anybody who answered the triangle test incorrectly were removed from consideration for degree of difference and preference. Additionally, any data points for preference which did not make sense (such as a person ranking a wine and its replicate at most and least preferred, when they correctly guessed the odd wine) were removed.
For descriptive analysis on February 15, any judge that did not completely rank the wines were removed from the data set. Then, one judge was randomly removed from Group 1 and on from Group 3. All judges were divided into 3 groups, each with 2 judges. For statistical purposes, judges were considered replicates and groups were considered judges. Data was analyzed using PanelCheck software V1.4.2. Because this is not a truly statistical set-up, any results which are found to be statistically significant (p<0.05) will be denoted as a “strong trend” or a “strong tendency,” as opposed to general trends or tendencies. The statistical significance here will ignore any other significant effects or interactions which may confound the results (such as a statistically significant interaction of Judge x Wine confounding a significant result from Wine alone). The descriptors used were Fruit Intensity, Minerality, Overall Aromatic Intensity, Reduction/Oxidation, Bitterness, and Body.
The same procedures for data analysis were used on the March 8 tasting. In this tasting, in order to balance the data sets for descriptive analysis, two judges from group one were transferred to group 3 and one judge from group 2 was eliminated. This resulted in three groups, each with 9 judges.
