Comparing precision, accuracy, and cost of malic acid testing using the Sentia Wine Analyzer and enzymatic kits
Matthieu Finot, Kirsty Harmon, AJ Greely
King Family Vineyards, Blenheim Vineyards, Hark Vineyards
Summary
Winemakers use malic acid testing to inform winemaking decisions such as the size of pre-fermentation acid adjustments and to determine when malolactic fermentation is complete. To inform these decisions, wineries need an accurate, precise, affordable and easy-to-use means of malic acid determination. Currently, paper chromatography and enzymatic kits are the most common methods for malic acid monitoring used by small to medium sized wineries in Virginia, however each of these approaches comes with drawbacks. The Sentia Wine Analyzer now offers a third approach that provides quantitative results in a short time with little laboratory expertise needed. In this experiment, four samples (juice, white wine, red wine with malic acid, red wine without malic acid) were tested in replicate by three winemakers using enzymatic tests and Sentia test strips in real-world winery settings. Precision, accuracy, cost, and time were compared between testing methods. ETS values were considered as the gold standard for accuracy. Both enzymatic testing and Sentia underestimated malic acid when it was high (2.5 g/L) and overestimated malic acid when it was very low (<0.05 g/L). Precision and accuracy were not strongly affected by running samples in different runs of enzymatic testing in most cases. Only one of the three experimenters was a trained scientist. Results from this experimenter were precise and accurate using either method. The other two experimenters had higher levels of variation with enzymatic testing while results using Sentia were within acceptable ranges for precision. Sentia also took less time per test than enzymatic testing. The consumables cost per test is higher for the Sentia ($6 per test) compared to commonly used enzymatic kits ($4.25-$5.22). Both test methods rely on accurate micropipetting. One experimenter experienced systemic error due to faulty pipettes that led to inaccurate results using both methods. Two experimenters acknowledged that the complex setup of enzymatic testing made them less likely to run the test. The simplicity of Sentia helped reduce this barrier to testing.
Introduction
Winemakers use malic acid testing to inform wine making decisions in several different circumstances:
-
To inform acid additions: Measuring malic acid at red grape processing allows the winemaker to better estimate the pH shift anticipated with malolactic fermentation. High malic acid levels may lead to higher shifts that can be offset with early acid additions. Measuring malic acid after the completion of fermentation but before malolactic fermentation allows the winemaker to fine tune acid additions based on how much malic acid may have been depleted during fermentation. For red or white grapes with high titratable acidity, it is useful to know the malic acid content as a predictor of the acid perception of the wine. Sparkling wine is a good example, here.
-
To monitor the progress of malolactic fermentation and confirm all malic acid is depleted prior to treatment with SO2. This is especially important for red wines that will be aged in the barrel for long periods or bottled without filtration.
-
To determine if malolactic fermentation is occurring in a wine NOT intended for ML, such as sparkling wine base or Sauvignon Blanc.
To inform these decisions, wineries need an accurate, precise, affordable and easy-to-use means of malic acid determination. Currently, paper chromatography and enzymatic kits (such as Megazyme, Unitech, Vintessential) are the most common protocols for malic acid monitoring used by small to medium sized wineries in Virginia. Paper chromatography does not allow for quantitative determination, so is not useful for scenarios I and III above. Chromatography also has a limit of detection of 0.3 g/L, potentially leading to false negative readings in scenario 2. In their review of 13 years of Collaborative Testing Services at Cornell, Howe et al1 indicate that 78% of samples sent for malic acid analysis were assessed using enzymatic analysis. (The other methods reported required equipment and expertise found in service labs but beyond the scope of small and medium sized wineries.) To use enzymatic analysis, a winery needs a spectrophotometer and accurate micropipettes. Good results require careful micropipetting and uninterrupted lab time for setup and execution of multi-step testing procedures. The Sentia Wine Analyzer is a portable handheld testing device with the capability to provide rapid determination of SO2, glucose, fructose, acetic acid, titratable acidity, and malic acid using proprietary test strips. Test strips were developed using technology from the medical device field. Manufacturer’s information states that no specialized skills are required for use and tests can be completed in under a minute. Malic acid testing with this method requires a single dilution step and sample application to the test strip.
In the Oct 2022 issue of Wine Business Monthly2, Richard Carey compared malic acid measurements of replicate samples of Chardonnay, Seyval, Concord and Brunello wines using two different Sentia meters, a CDR WineLab and Megazyme enzymatic kits (measured with a spectrophotometer). His results showed high levels of precision within values for Sentia and Megazyme kits. CDR WineLab values were less precise in the Chardonnay and Seyval samples. It is difficult to determine the accuracy of these results, as the absolute value of the wines tested was not reported. However, Sentia and Megazyme values were in very close agreement while the CDR WineLab had higher overall values for the white wines and reported all red wine malic acid values <0.05 g/L.
Dr. Carey has extensive experience in the laboratory and operates a wine testing lab as part of his consulting business (Tamanend Wine, Inc). Most winemakers in Virginia do not have a background in laboratory science and therefore may not produce as precise results. The purpose of this experiment was to compare the precision and accuracy of malic acid measurements taken with the Sentia Wine Analyzer with those produced by enzymatic testing under real-world winery conditions.
Methods
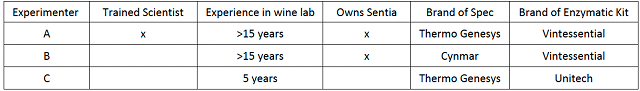
Three winemakers were recruited for participation in this trial (Table 1). Experimenter A is a trained scientist with extensive laboratory experience, now working as a winemaker. This experimenter was an early adopter of the Sentia device for use with SO2 testing. Experimenter B does not have specialized scientific training but has been working as a winemaker and performing laboratory tests for many years. This experimenter also purchased a Sentia device prior to the release of the malic acid test strips. Experimenter C does not have specialized scientific training and is relatively new to the wine lab. This winemaker pays close attention to detail and has been trained in basic wine lab protocols (pH, SO2) but has limited experience with pipetting and enzymatic testing, and has limited prior experience with Sentia.
Table 1: Three winemakers were recruited to represent a range of scientific and laboratory experience
Sample preparation
Juice and wine samples were prepared in small sample tubes (Eppendorf tubes) with random number codes. In all, five replicates were run of each sample by each method. Replicates of the same sample were given different number codes. During preparation, juice samples were thawed, briefly microwaved to inactivate malolactic bacteria, prepared in sample tubes, then refrozen for delivery to experimenters and ETS. Experimenters were instructed to thaw frozen samples completely prior to malic acid determination. Wine samples were stored in the refrigerator after receipt. Samples were hand delivered to each experimenter and shipped to ETS for analysis within the same week.
Experimenters were asked to run each sample and report results into a shared spreadsheet within one week of receiving the samples. To replicate real-world winery situations, participants were instructed to run specific samples in specific runs. Each run of enzymatic testing included 8 samples, a blank and a standard. Within runs, sample order was randomized between experimenters. For each experimenter, each sample type was tested to include at least one instance of repetition (two samples of the same juice/wine within the same enzymatic run) and at least one instance of replication (same juice/wine run in different enzymatic runs). The WRE provided experimenters with the enzymatic kit of their choice while Sentia provided test strips and buffer solutions free of charge for the experiment. Experimenters A and B already owned a Sentia device. Sentia provided a device to Experimenter C for the experiment. Each Sentia device was running up-to-date software at the time of testing.
To assess cost, experimenters were surveyed and asked what brand of enzymatic kit they used (including cost and number of tests per kit), how many samples were included in an average test run, as well as how many blanks and standards. They were also asked for any other considerations they made while running enzymatic tests.
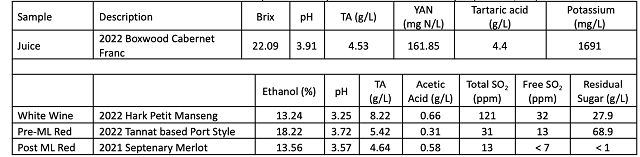
Table 2: Juice and wine chemistry for four samples used in malic acid analysis (Vinterra, ICV)
Results
Winemakers are most concerned with the accuracy (the difference between the measured value and the true value) and precision (how well our methodology will produce the same result when performed multiple times)3 of a testing method. Each of the testing strategies used in this experiment have been developed with the goals of accuracy and precision in mind.
To determine accuracy, all samples were sent to ETS Labs (St. Helena, California) in parallel with experimental testing. ETS has been conducting wine laboratory testing in the United States since 1978 and is considered the gold standard for laboratory analysis. ETS maintains multiple formal accreditations for quality wine analysis and has extensive quality control programs in place to ensure accurate results.
Several measures of precision are also reported here.
-
The range indicates the spread of results produced through testing and indicates how disparate the results could be. Most winemakers are making their decisions based on a single run of the test, so knowing the range is an important consideration.
-
The standard deviation is a measure of the spread of data around the mean. Based on a normal distribution of data, 68% of the readings will fall within one standard deviation on either side (positive or negative) of the mean and 95% of the readings will fall within two standard deviations of the mean. This gives an idea of how spread out the data really are (how many outliers contribute to a wide range).
-
The coefficient of variation (CV) indicates the range within which the true value of the analysis is thought to fall given the imprecision in repeated testing. CV is calculated by dividing the standard deviation of a group of readings by the mean of that same group4. Wilkes5 sets a standard of <5% while Iland et al4 consider <10% acceptable.
For winemakers, quantification of malic acid in the winery is most likely to change wine making decisions when values are very high (above 2.5 g/L) or very low (<0.05 g/L). Juice and wine samples chosen for analysis all had malic acid values within the limit of detection of the methods used (Table 2), however they were sometimes close to these limits.
Sources of Error
Several sources of error may affect the accuracy and precision of results. Systemic sources of error for the methods used in this study include the calibration of pipettes (both Sentia and enzymatics) and the accuracy of the spectrophotometer (enzymatics only). Potential human errors include organization, time, number of interruptions, and experience with pipetting. Additional sources of error come with the testing method including variation in the solutions provided, effects of shipping and storage, accuracy of standards used, and goodness of fit for any algorithms used to determine values.
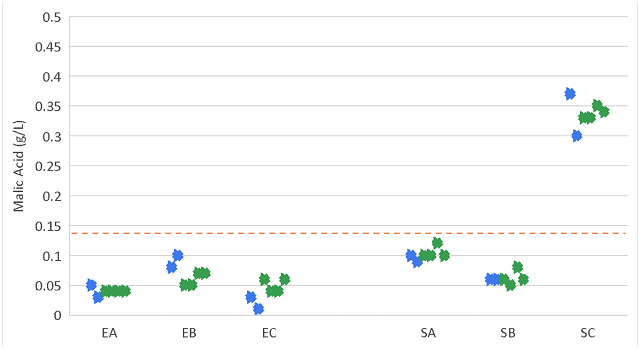
After all of the samples had been run and data had been unblinded and plotted, it became clear that some systemic error was occurring with results from Experimenter C. Juice values (Figure 1), white wine (Figure 2) and red wine (Figure 4) all showed results clustering closely together (very precisely) but as outliers to the other data. Further investigation indicated that the micropipettes at winery C were not well calibrated. Depending which micropipette was used (P200 vs. P1000), these results were consistently too high or too low. Enzymatic analysis requires a higher degree of expertise with micropipettes than Sentia, however due to the dilution step, Sentia analysis still relies on accurate micropipetting. To assess accuracy and precision with and without this systematic error, Table 3 reports summary statistics with experimenter C values included (a) and excluded (b).
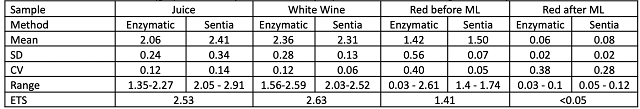
Table 3a: Malic acid (g/L) of four samples measured by three winemakers using two winery based methods

Table 3b: Malic acid (g/L) of four samples measured by experimenter A and B using two winery based methods.
Juice Sample: The juice sample used in this experiment came from Cabernet Franc grapes sampled during an experiment at Boxwood Winery in 2022. Juice samples had been frozen for another purpose and were thawed for malic acid testing. General chemistry of the sample can be found in Table 2.
Accuracy: ETS reported the malic acid content of this Cabernet Franc juice sample to be 2.53 g/L. Sentia reported global means closer to the ETS value than enzymatic testing (2.06 g/L vs. 2.41 g/L)(Table 3, Figure 1). This value is within the limit of detection listed for Sentia. The Vintessential kit does not list specific limits of detection, but rather instructs that sample dilution should ensure the concentration of test solution is no more than 0.4 g/L, suggesting a 1:5 dilution. Unfortunately, for very high values, additional dilution may be needed, leading to multiple testing runs. The Unitech kit comes in two types, one has a limit of detection of 1.5 while the other is extended range to 4 g/L.
Precision: The overall standard deviation in juice malic acid values among all labs was lower for enzymatic testing than for Sentia (0.24 vs. 0.34)(Table 4). Experimenters A and B both had very low levels of deviation for both Sentia and Enzymatic testing protocols (Figure 1). Experimenter C had a single outlier result with enzymatic testing and overall higher values with the Sentia device, likely due to pipette calibration.
Figure 1: Malic acid (g/L) measured in a sample of Cabernet Franc juice by three winemakers using two methods. All samples were prepared at the same time. Measurements in blue were run in one round of testing, measurements in orange were run in a second round of testing. Red line indicates the value measured by ETS for this sample.

White Wine Sample: The white wine sample used in this experiment was Petit Manseng produced by Hark Vineyards in 2022. Petit Manseng was used due to its high acidity. The general chemistry of the sample can be found in Table 2.
Accuracy: ETS reported the malic acid content of this Petit Manseng wine to be 2.63 g/L (Table 3). Once again, values reported with enzymatic testing (2.36 g/L) and Sentia (2.31 g/L) were below this number, however this is within a range in which wine making decisions would likely be the same.
Precision: Though global precision was nearly the same between methods, with standard deviations of 0.31 and 0.39, individual deviations were much lower with the Sentia than with enzymatic kits (Figure 2). Both Experimenters B and C were less precise with enzymatic testing, returning a fairly high range of values (>0.5 g/L). For Experimenter B, this appears to be a single low value, leading to a difference of nearly 1.0 g/L between samples of the same wine in the same run. For experimenter C, four of the six replicates tested produced values more than 0.5 g/L lower than the ETS value. Once again, pipette calibration likely affected results for Experimenter C.
Figure 2: Malic acid (g/L) measured in a sample of Petit Manseng wine by three winemakers using two methods. All samples were prepared at the same time. Measurements in blue were run in one round of testing, measurements in orange were run in a second round of testing and measures in green were run in a third round of testing. Red line indicates the value measured by ETS for this sample.

Pre-malolactic red wine:
Winemakers looking to adjust acid after primary fermentation before malolactic fermentation are wise to consider the amount of malic acid at that time. If wines go through malolactic fermentation before pressing, winemakers run the risk of over addition if they still expect pH to rise due to ML. At the time of testing, however (June 2023), red wines had already completed malolactic fermentation. In order to find a red wine that still contained considerable malic acid, a Port style Tannat wine from Michael Shaps Wineworks was used. This wine was produced by halting fermentation using brandy while sugar and malic acid remained in the wine. Consultation with the manufacturers of each testing approach indicated high sugar and high alcohol levels should not affect results of malic acid testing. The chemistry of this wine can be found in Table 2.
Accuracy: ETS reported malic acid content of this port-style red wine to be 1.41 g/L. The global average for enzymatic testing was 1.42 g/L while Sentia averages 1.50 g/L (Table 3).
Precision: For this wine, Sentia had much lower overall deviation than enzymatic kits for all experimenters, with a standard deviation of 0.1 vs. 0.6 for enzymatic testing methods (Table 2). Both Experimenter B and Experimenter C had notable outliers when using enzymatic tests (Figure 3). Experimenter C had a range of values between runs of the test, with each run returning very different average results, illustrating the potential for differences between runs in these tests. Experimenter B had one aberrantly high and one aberrantly low result, despite also having other samples in the same run returning values very close to the ETS value (Figure 3).
Figure 3: Malic acid (g/L) measured in a sample of Red Port wine by three winemakers using two methods. All samples were prepared at the same time. Measurements in blue were run in one round of testing, measurements in orange were run in a second round of testing and measures in green were run in a third round of testing. Red line indicates the value measured by ETS for this sample.

Post-malolactic red wine:
Perhaps the most important decision a winemaker makes based on malic acid content is when to consider a wine finished with malolactic fermentation, leading to the addition of SO2. For this reason, it is essential that malic acid quantification returns accurate results at the low end of the limit of detection. The level of malic acid beyond which winemakers consider a wine finished with malolactic fermentation varies. Zoecklein et al (1995) report that in a survey of US winemakers, 30% considered a wine “safe” at malic acid concentrations below 30 mg/L (the limit of detection of paper chromatography) while 66% required 15 mg/L6. AWRI recommends aiming for a malic acid result of “not detected” (usually lower than 0.05 g/L), however a result of 0.1 g/L or less may be low enough to consider the wine at low risk of spoilage7.
The post-malolactic wine sample used in this experiment was a 2021 Merlot from Septenary Winery at Seven Oaks Farm. This wine had previously been confirmed by a service lab (ICV Labs, Toulouges, France) to have finished malolactic fermentation.
Accuracy: The limit of detection of the test method used by ETS is 0.05 g/L. ETS measured the malic acid of this sample to be below that limit (<0.05 g/L). Winery enzymatic testing results averaged 0.06 g/L, with all of the values below 0.1 g/L while Sentia averaged 0.08 g/L (Table 3).
Precision: This wine showed the highest level of precision for all experimenters, with very low standard deviations, likely due to the very low overall value of the metric (Table 2). However, these often corresponded to high CV’s. For this sample, the range of results for enzymatic testing was 0.03 – 0.1 g/L while the range for Sentia was 0.05 – 0.12 g/L. It is likely a winemaker would decide to add SO2 if malic acid measured 0.05 g/L while a result of 0.12 g/L might not lead to that result. Practically, if in-house testing reports very low malic acid values, repeating the test may be prudent to confirm results prior to deciding to add SO2 or to allow the wine to continue to ferment.
Figure 4: Malic acid (g/L) measured in a sample of finished red wine by three winemakers using two methods. All samples were prepared at the same time. Measurements in blue were run in one round of testing, measurements in green were run in a separate round of testing. Red line indicates the value measured by ETS for this sample.
Time, effort, and cost
Experimenters were asked to run tests with 8 samples per run, allowing for a blank and a standard for each 10-sample run. For each run, experimenters recorded starting and ending time. Testing time and cost per sample was calculated based on this arrangement. This method likely underestimated time on task for enzymatic testing in standard winery situations, as not every sampling run includes 8 samples. Running fewer than 8 samples per run would also increase the cost per test.
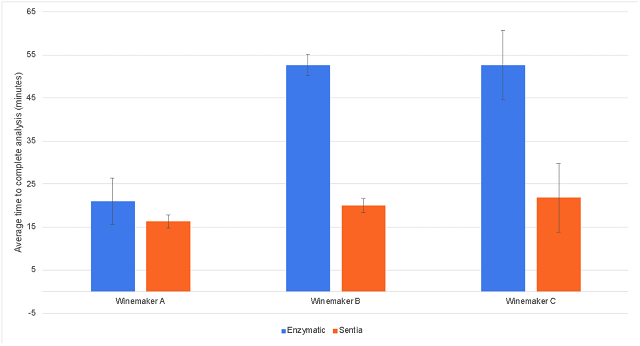
Enzymatic tests have a set incubation time of 15-20 minutes depending on the brand of kit used, however setup time varies by experimenter (Figure 5). Experimenter A has more extensive laboratory experience, likely leading to less time needed for organization and setup. Sentia testing occurs one test at a time and includes a single dilution step, leading to shorter time needed overall. Experimenters also remarked that, though enzymatic testing might be efficient for larger testing runs, Sentia testing was more convenient when only 2 or 3 samples needed to be tested. Conversation with winemakers also indicated a higher barrier for initiating enzymatic tests due to the focus and uninterrupted time needed to complete the test.
When the startup costs are ignored, the cost per test for the consumables used in enzymatic testing is approximately $1.25 lower than the same cost for the Sentia strips and buffer (Table 4). However, the cost per test for enzymatic tests increases when fewer than 8 tests are run each time. Smaller wineries are less likely to run 8 tests at a time, so this cost difference may not be relevant.
Table 4: Comparison of costs. The cost per test for enzymatic tests assumes a 10-sample run with 2 tests used for blank & standard. Sentia costs include test strips plus buffer. Startup costs estimate cost of pipettes and equipment.
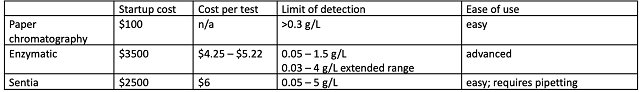
Figure 5: Experimenters tracked time required to perform each of 3 runs of 8 samples each. Error bars indicate standard deviation.
Role of winemaker experience
Winery laboratory testing methods are developed with precision and accuracy in mind. However, each test still requires good lab practices and careful attention to detail. Some tests require additional skills or knowledge, such as accurate micropipetting, standardization of solutions, or machine calibration. Many tests also rely on the accuracy and precision of equipment such as spectrophotometers or detection meters. In this study, winemakers were chosen with a range of laboratory experience to assess how precise and accurate different testing methods would be under real world conditions. One way to determine the overall precision of a test is the confidence interval. This measure is calculated by dividing the standard deviation of a group of readings by the mean of that same group4. Wilkes5 sets a standard of <5% while Iland et al4 consider <10% acceptable. Overall confidence intervals for all tests are shown in Table 3. Figure 6 shows CV values for individual experimenters. CV values for the post-malolactic red wine were very high due to the very low amount of malic acid in the wine, so they are not included here. These data show that Experimenter A had high precision (low CV) with either test. Experimenters B and C also had high precision (low CV) with Sentia, but results from enzymatic tests were less precise. For less experienced winemakers using enzymatic tests, running replicated samples may be needed when making wine making decisions such as when to add SO2 to a wine. This adds to the time and cost of testing.
Figure 6: Coefficient of variation for each experimenter for three different wines tested. Only wines with detectable malic acid are included. Coefficient of variation indicates the range within which the true value of the analysis is thought to fall given the imprecision in repeated testing. CV is calculated by dividing the standard deviation of a group of readings by the mean of that same group4. Wilkes5 sets a standard of <5% while Iland et al4 consider <10% acceptable.

References
(1) Howe, P. A.; Ebeler, S. E.; Sacks, G. L. Review of Thirteen Years of CTS Winery Laboratory Collaborative Data. American Journal of Enology and Viticulture 2015, 66 (3), 321–339. http.
(2) Carey, R. A New Instrument for Wine Analysis. Wine Business Monthly 2022, October, 26–33.
(3) Butzke, C. E.; Ebeler, S. E. Survey of Analytical Methods and Winery Laboratory Proficiency. American Journal of Enology and Viticulture 1999, 50 (4), 461–465.
(4) Iland, P.; Bruer, N.; Edwards, G.; Weeks, S.; Wilkes, E. Chemical Analysis of Grapes and Wine; Patrick Iland Wine Promotions PTY LTD: Campbelltown, Australia, 2004.
(5) Wilkes, E. Practical Measurement of Total SO2 in Wine. Wine and Viticulture Journal 2018, Spring, 3.
(6) Zoecklein, B.; Fugelsang, K. C.; Gump, B. H.; Nury, F. S. Wine Analysis and Production; Springer: New York, 1995.
(7) Achieving Successful Malolactic Fermentation, 2020. https://www.awri.com.au/wp-content/uploads/2011/06/Malolactic-fermentation.pdf.
Appendix A: Participant Participation Form
Comparing precision, accuracy and cost of malic acid testing using Sentia Wine Analyzer with currently used enzymatic kits
A WRE Study
The purpose of this study is to assess the accuracy and precision of commonly used methods to assess malic acid in the winery. The test includes white and red wine as well as juice at malic acid levels commonly found within winery operations. Following are instructions for storage and analysis of juice and wine samples for malic acid.
Upon receipt of your samples, please store wine samples in the refrigerator and juice samples in the freezer. Thaw juice samples completely and mix thoroughly before analysis.
Each sample tube has been labeled with a random number. A spreadsheet has been created to record malic acid values for each of the samples you have received. A link to this spreadsheet will be emailed to you. To best mimic real-world conditions
-
Please run samples in the order and groups indicated on the spreadsheet. If you have not yet received a link to your spreadsheet, contact Jenna (wrevault@gmail.com).
-
For Sentia testing, please follow the manufacturer’s instructions for sample dilution. Follow the spreadsheet for instructions of which samples to run in concert with each enzymatic run.
-
Record malic acid results for all samples in the spreadsheet.
-
Please complete all testing within one week of receipt of the samples.
After you have completed sample analysis, you will receive a link to a brief questionnaire to assess cost and efficiency of your normal protocol for malic acid determination as well as any feedback you have on the comparison of these methods.
Once samples have been analyzed the WRE will calculate mean, standard deviation and confidence interval for each participating laboratory. You will receive individual feedback on precision and accuracy for your own laboratory. Global statistics will also be calculated and shared through WRE channels. Results will be kept anonymous for public reporting.