Tartaric acid addition at the beginning of fermentation improves wine quality

Kirsty Harmon, Matthieu Finot, Joy Ting

June 2023

ASEV 2023 Abstract Introduction Round 1: Pre-fermentation acid addition based on the previous year led to over acidulated wine Round 2: Potassium concentration was used to determine the rate of pre-fermentation tartaric acid addition Summary of Results Links to the Full Reports References

ASEV 2023

After 6 different production scale experiments exploring pre-fermentation tartaric acid additions at Blenheim Vineyards and King Family Vineyards, we decided it was time to step back and see if there were any actionable trends that emerged. Each of the experiments that contributed to this summary were presented individually at WRE sensory sessions in 2021 and 2022. Links to those experiments can be found at the end of this module. 

The following text was presented as part of the poster session at the American Society of Enology and Viticulture conference in Napa, California, June 28, 2023.

Abstract

Practical strategies for early tartaric additions to high pH Cabernet Franc and Petit Verdot in Virginia

Cabernet Franc and Petit Verdot are the two most widely planted red grape varieties in Virginia. Despite characteristics that produce good quality fruit and distinctive wines, high fruit potassium often leads to wines with high pH. A common winemaking approach to rectify high pH is through relatively large tartaric acid additions, but winemakers differ in when these additions are made. Pre-fermentation additions are often recommended; however, this approach lacks guidelines to determine how much acid to add to achieve a target pH without adverse sensory consequences. In 2020 and 2021, the Virginia Winemakers Research Exchange tested the chemical and sensory effects of adding relatively large amounts of tartaric acid at fruit processing compared to post-malolactic additions. Initially, additions were done based on prior experience, resulting at times in over addition and wines with high sensory scores for acidity. In the second year, measurement of juice potassium prior to inoculation was used to estimate the final wine pH. Using published data from other regions and historical data sets from Virginia, ranges of potassium (low, medium, high, very high) were defined and tartaric additions were done according to where juice values fell within those ranges. As expected, juice potassium was a better predictor of wine pH than juice pH. Measuring juice potassium avoided over-acidulation in each of the trial wines. Wines with pre-fermentation acid additions had lower volatile acidity and were scored as more “fresh” than wines with post-fermentation additions. Based on this approach, assessing juice potassium prior to inoculation may be a practical strategy to inform the magnitude of pre-fermentation acid additions and avoid adverse sensory effects of over addition.

Introduction

  • Despite routine tartaric acid additions, red wines in Virginia finish fermentation with high (>3.65) or very high (>3.85) pH, putting wine at risk of microbial spoilage and poor color retention. 
  • Winemakers are often encouraged to add tartaric acid early in fermentation1,2, but bench trials of pre-fermentation acid additions have poor predictive value for final wine pH.
  • Academic models predicting wine pH from juice chemistry3,4 include values that are not practical to measure at small and medium sized wineries during harvest and do not include recommendations for tartaric acid addition levels in real world conditions. 
  • The consequences of over-acidulation are as serious as microbial spoilage.

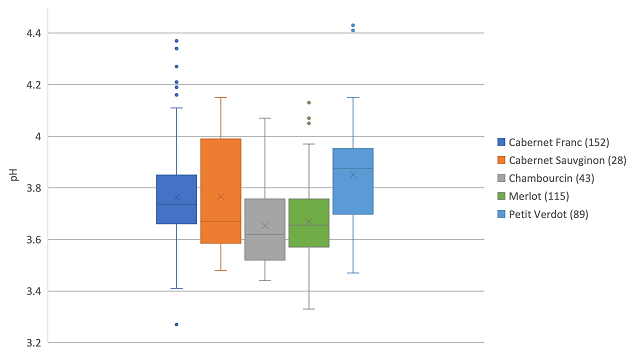
Figure 1: pH of finished wine for common red varieties in WRE trials (2014-2021)

Round 1: Pre-fermentation acid addition based on the previous year led to over acidulated wine

In 2020, a production scale experiment at Blenheim Vineyards (Charlottesville, VA) explored the effects of pre- fermentation acid addition in Petit Verdot. Two Tbins of must were acidulated with 4 g/L tartaric acid, based on the total amount of acid added the previous year. Two Tbins of must were left without acidulation as controls. All other operations and additions were the same between treatments.

Modified sensory analysis of finished wines was completed after 6 months of barrel aging by a panel of 25 wine producers. The wines were different in a triangle test (Z=1.77, p=0.04), and the acidulated wine received high scores for acidity and low scores for volume/body compared to control. Open ended questions and group discussion after scoring indicated this wine was over acidulated by commercial standards.

Round 2: Potassium concentration was used to determine the rate of pre-fermentation tartaric acid addition

Introduction

In Virginia, juice pH is a very poor predictor of wine pH. Many aspects of Virginia terroir lead to high potassium in grapes5-6. Large jumps in pH at the beginning of fermentation indicate that precipitation of potassium bitartrate may be driving high pH values in finished wines. Measuring pre-fermentation potassium may provide a practical guide for pre-fermentation tartaric acid addition.

Methods

Using published values from other regions1,2,7,8 and historical data from Virginia, a generalized scale of juice potassium concentration was defined, with recommended tartaric acid additions for moderate to very high potassium concentrations.

The experiments were carried out on four different production scale lots. Wine was made according to the standard protocol of the winery except for tartaric acid addition. At processing, juice samples were sent to ETS (St. Helena, CA) for potassium analysis. For each lot, a control wine was not acidulated while a treatment wine received a tartaric acid addition based on potassium concentration. Control wines were acidulated after the completion of malolactic fermentation to the same pH (Blenheim) or addition rate (King Family) as the treated wines. Modified sensory analysis compared wines after acidulation and 6 months of barrel aging. Full experimental details can be found in the linked reports.

Summary of Results

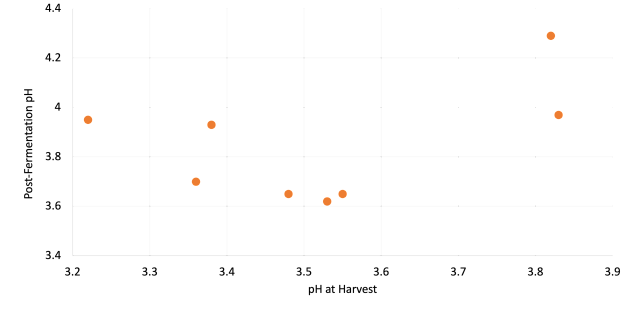
Figure 4a: Juice pH was a poor predictor of of wine pH.


Figure 4b: Potassium was a much better predictor of wine pH.

Tartaric acid addition based on potassium concentration produced wines with healthy pH values while avoiding over acidulation

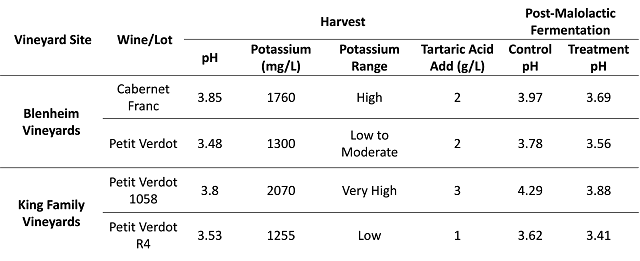
Table 2: Wines that received pre-fermentation tartaric acid additions according to their potassium concentration completed fermentation with pH<3.8. The exception (KFV 1058) was under acidulated according to the model. Very high potassium juice required up to 4 g/L acidulation. Blind acidulation would have led to over acidulation of lower potassium wines

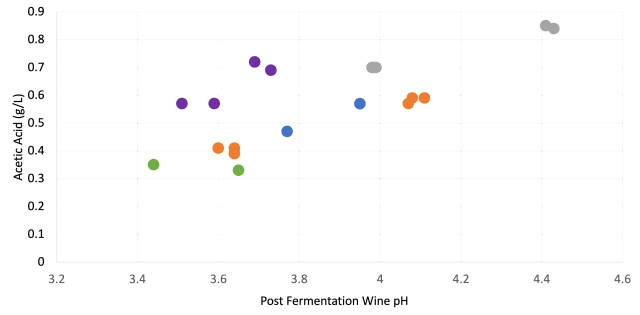
Wines that received pre-fermentation acid additions had lower acetic acid than wines that received post-fermentation additions.

Figure 5: Early (pre-fermentation) acid addition led to wines with lower acetic acid. Wines from the same lot are shown in the same color. Ex: Purple dots indicate two barrels of each treatment of King Family Vineyards Petit Verdot R4). One exception to the trend (green dots) is a low potassium wine with low pH regardless of acidulation.

Summary of Sensory Results:  Wines with pre vs. post fermentation acid addition were not consistently distinguished from one another in triangle tests. When distinguished, wine with early additions received scores for fruit character consistent with “fresh” fruit vs. “cooked” fruit in wine with later additions, while scores for "acidity" were not different.


References

1.Gardner, Denise. “Making (Red) Wine from Fruit High in Potassium.” Penn State Extension Wine & Grapes U. (blog), September 23, 2016. 

2.“Ask the AWRI: Winemaking with High PH, High TA and High Potassium Fruit.” Grapegrower and Winemaker October, no. 657 (2018).

3.Boulton, Roger. “The General Relationship Between Potassium, Sodium, and PH in Grape Juice and Wine.” American Journal of Enology and Viticulture 31, no. 2 (1980): 182-186.

4.Gómez, J., C. Lasanta, J.M. Palacios-Santander, and L.M. Cubillana-Aguilera. “Chemical Modeling for PH Prediction of Acidified Musts with Gypsum and Tartaric Acid in Warm Regions.” Food Chemistry168 (2015): 218–224. 

5.Wolf, Tony Kenneth, and Natural Resource, Agriculture, and Engineering Service, eds. Wine Grape Production Guide for Eastern North America. NRAES 145. Ithaca, N.Y: Natural Resource, Agriculture, and Engineering Service (NRAES) Cooperative Extension, 2008.

6.Moss, Russel. “Potassium in Viticulture and Enology.” Virginia Cooperative Extension Viticulture Notes, May 2016. 

7.DeScenzo, Rich. ETS Labs, St. Helena, California. Personal Communication, August 22, 2019.

8.Berg, H W, Min Akiyoshi, and M A Amerine. “Potassium and Sodium Content of California Wines.” American Journal of Enology and Viticulture 30, no. 1 (1979): 55–57.

Contact

Sign up for our Mailing List