Harvest Reminders Part 2

Joy Ting

August 2020

Obtaining a Representative Vineyard Sample Vineyard Sampling Methods: Clusters vs. Berries vs. Vines Why and How to Measure Sugar per Berry Care and feeding of wine yeast

With everything that has happened so far in 2020, harvest has snuck up on me once again. As I scramble to be ready (finalizing protocols, sending out sample bottles, ordering lab supplies), I find myself looking through my old notes to remember how to do this. What is the conversion factor for alcohol? What is a good target YAN? In that spirit, this month’s newsletter will be much more reminding than new material, including links to past articles along with a few new ones.

One trend we are seeing in initial sampling of white varieties is low Brix/high pH/high TA. I plan to dig into this topic through the week this week and hope to have some support materials out to you early next week if this is something you are seeing in your fruit.

Whether you are just starting to pick or have been at it for a few weeks already, I wish you all the best as you bring in the harvest this year. As always, if there is anything I can help you with, please feel free to reach out.

Additional guidelines and reminders were also covered in Harvest Reminders Part 1.

Obtaining a representative vineyard sample, August 2020

Joy Ting

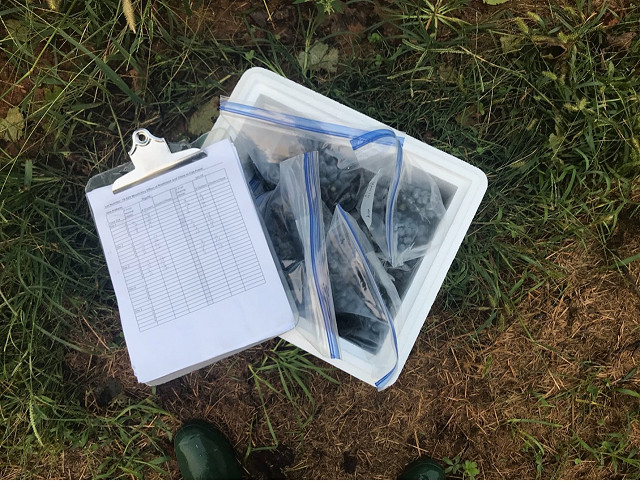
Figure 1: from UC Davis Wine Production VID 252, UC Davis Extension, n.d.

Vineyards are variable places. No matter how well you sample the vineyard, you will still likely have some deviation from the actual value. However, paying attention to the most common areas of variation can help align the sample value with the real value. Differences in heat, light, and soil moisture are known to be important drivers of grape maturity (1) and are important factors when thinking about your grape sampling regime. Variations in these can occur on three main levels:

  1. Between vine variation: Many important factors differ from one vineyard row to the next (or one side of the row to the other). If you have large differences in soil, water availability, exposure, crop load, or vine age within the vineyard block, make sure your sample represents this diversity or break the block into more homogenous portions for sampling. Sampling both sides of multiple rows helps account for these variations, and a sampling unit should not exceed 2.5 acres (2).
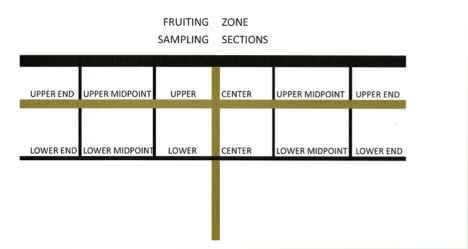
  2. Within vine variation: Clusters on the same vine can experience differences in heat and light, as well as different allocation of vine resources. When sampling, be intentional about sampling from each of the different fruiting zones (Figure 2) from clusters in the back and front of the vine.
  3. Within cluster differences: Berries within a cluster can experiences differences in light and heat as well as differences due to berry size and disease. Wolpert and Howell (1984)(3) found Brix levels underripe Vidal berries could span from 13-19° Brix in the same cluster, though this difference diminished with maturity.

Practically, how do you obtain a sample that is representative of all the grapes in the vineyard? It is best to follow a prescribed method and follow it every time.


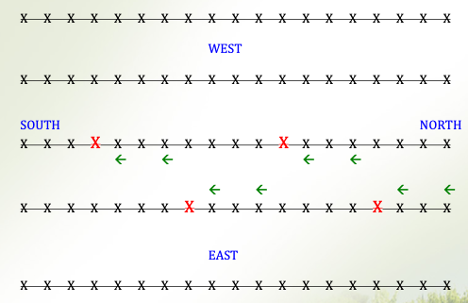
Figure 2: from: UC Davis WIne Production VID 252, UC Davis Extension, n.d.

  • Sample at the same time of day, preferably in the morning as long as the fruit is not wet.
  • Decide before you begin which rows you will sample to ensure you cover the span of the vineyard. Divide your target number of berries (ex: 200) by the number of rows so you know how many berries you need per row. Don’t sample the edge rows as these are not representative. Try to take samples from at least 10-20% of the rows in the vineyard.
  • As you walk the rows, alternate sides so that you take samples from both sides of the canopy. 
  • Walk a specific number of steps between samples and be consistent so you represent each portion of the row. After you sample the first row, check the number of berries you have to determine if you need to increase or decrease your steps to obtain you target number of berries in your predetermined number of rows.
  • Alternate taking berries from upper and lower clusters; this is especially important in Ballerina trained systems where bottom clusters are less exposed. Also alternate sampling from the center, midpoint and end of the cane. 
  • Alternate taking samples from top, middle, and bottom, front and back of the cluster.
  • Sample regularly (once per week initially, then more often as ripening progresses) to determine the trajectory of ripening.
  • While you are walking the rows, observe the overall appearance of the vines. Are they looking healthy or starting to shut down? What diseases or other pests are apparent? Write these observations down as soon as you finish sampling.
  • If you are cluster sampling, you don’t have to worry about which part of the cluster you are sampling from, but you have fewer opportunities to make sure you have represented the whole vineyard, so it is even more important that you spread out samples from different rows, both sides of the row, and different exposures within the canopy (top and bottom, front and back).

Sampling bias can also be a factor in the accuracy of a grape sample. As humans, we tend toward a bias of picking grapes that are most apparent, and most ripe. To avoid this, Zoecklein (2002)(2) recommends locating the fruit zone, the sampling without looking at the clusters. 


References

(1) Zoecklein, B. W. Grape Sampling and Maturity Evaluation for Growers https://www.apps.fst.vt.edu/extension/enology/VC/Jan-Feb01.html (accessed Oct 30, 2019).

(2) Zoecklein, B. W. # 53 Grape Sampling, Asynchronous Berry Development, 2002 Vintage. Enology Notes, 2002.

(3) Wolpert, J. A.; Howell, G. S. Sampling Vidal Blanc Grapes. II. Sampling for Precise Estimates of Soluble Solids and Titratable Acidity of Juice. American Journal of Enology and Viticulture 1984, 35 (4), 242–246.


Vineyard sampling methods: clusters vs. berries vs. whole vine

It comes up every year. Which is better – cluster sampling or berry sampling? After reading through some of the available literature, here is what I have found so far:

  1. Both cluster sampling and berry sampling yield roughly the same overall Brix numbers (1,2). Not all papers look beyond Brix, but those that did found similar pH, TA, and phenolics numbers as well (3). However, these were all done with adequate number of clusters and berries per sample (see below). It is also important to note most of these studies were done in very small plots. Results may be different with production sized vineyards.
  2. Berry sampling gives a lower overall variation than cluster sampling. Amerine and Roessler (1958)(1) compared three sampling methods: berry, cluster, and sentinel vine sampling. When they compared the results of berry samples (100-200 berries), cluster samples (10 clusters each) and whole vine harvesting, they found they all of the methods averaged around the same mean Brix level. However, the variation between samples was least for berry samples and most for whole vine samples. This means that the range of possible answers when they sampled these 10 times was wider for whole vines and clusters than berries.  They concluded that sentinel vine sampling is best for uniform vineyards and clusters are best for varieties that are known to have large variations within clusters (Zinfandel in California, potentially Petit Verdot for Virginians), but berries are most appropriate for most varieties.  
  3. Several investigations found that between vine variation was larger than within vine or within cluster variation, even in very small experimental plots (18 – 33 vines)(2,4,5). It is likely the between-vine variation in a full vineyard block is even higher. Sampling a larger number of vines/rows may be more important than sampling all of the berries in the cluster.
  4. One argument cited against berry sampling is that the outside berries (sampled with berry sampling) do not represent the berries within the cluster well. Tang et al (2019)(3) studied the relationship between visible berries and bunch maturing in Chardonnay and Shiraz. They found strong correlations in Brix, pH and TA with slightly less correlation in anthocyanins and phenolics. The correlation was not always 1:1, but was consistent year to year, allowing for correction. They also found the correlation was stronger with a larger number of samples and as fruit was riper (meaning, there was more within cluster variation early in ripening than later).  In their models, Brix measurements from outer berries were within +/- 0.58 units of the whole bunch in Chardonnay and +/- 0.62 in Shiraz. 

How many berries or clusters do you need to get a representative sample?

Unfortunately, most of the studies I have found so far focus on precision (how likely are you to get the same number each time) rather than accuracy (how closely does your result match the juice at harvest). However, when deciding your target sample size, consider the following:

  • When determining the sample size needed to discriminate differences in experimental plots, Kasimatis and Vilas (1985)(2) found that two 50-berry samples and two 10-cluster samples were equally sensitive.
  • Rankine et al (1962)(4) compared results from a 32-cluster sample with the actual value of 0.5 ton harvest from 34 different vineyards. Of these, 19 samples estimated the true value within 0.5 Brix while 15 differed by more than 1.0 Brix. Berry samples were not used in this portion of the work. The same authors found that berry samples (100 berries and 200 berries) did as well or better estimating the Brix level when compared to total crop as 64 cluster samples. Both methods were more likely to overestimate Brix levels than underestimate them.
  • Zoecklein (Enology Notes 54) recommends the following guidelines for sampling size:
    • Within 1 degree Brix: 2x100 berries or 10 clusters
    • Within 0.5 degree Brix: 5x100 berries (no cluster number is given)

Ultimately the best way to determine the sampling method that is most accurate for your vineyard is to do both types of samples just before harvest, and see which is most accurate once the harvest comes in. Sounds like a great experiment!


References

  1. Amerine, M. A.; Roessler, E. B. Field Testing of Grape Maturity. Hilgardia 1958, 28 (4), 93–114.
  2. Kasimatis, A. N.; Vilas, E. P. Sampling for Degrees Brix in Vineyard Plots. American Journal of Enology and Viticulture 1985, 36 (3), 207–213.
  3. Tang, J.; Petrie, P. R.; Whitty, M. Modelling Relationships between Visible Winegrape Berries and Bunch Maturity: Visible versus Bunch Maturity. Australian Journal of Grape and Wine Research 2019, 25 (1), 116–126.
  4. Rankine, B. C.; Cellier, K. M.; Boehm, E. W. Studies on Grape Variability and Field Sampling. American Journal of Enology and Viticulture 1962, 13, 58–72.
  5. Wisdom, J. M.; Stuckey, A. W.; Considine, J. A. Hierarchical Modelling Partitions Variation in Vineyard Fruit Maturity for Optimal Sampling. Australian Journal of Grape and Wine Research 2020, 26 (2), 148–157. 


Why and How to Measure Sugar per Berry

Several measures of fruit maturity are commonly used in Virginia vineyards, but none is a perfect indicator of ripeness. I wrote an article for the Grape Press in the Winter of 2019, beginning on page 6, that outlines how and why to incorporate sugar per berry into your sampling plan.

View Article

Care and feeding of Wine Yeast (i.e. nutrition)

Joy Ting

I recently asked Bruce Zoecklein what he thought was the primary driver of volatile acidity in Virginia Wine. He mentioned two things: lack of proper hygiene (including monitoring of hygeine practices) and poor yeast nutrition. To be honest, I was prepared for the first one, but surprised by the second. This does make sense when you recall that improper feeding of yeast during fermentation leads to stress, and when yeast are stressed, they produce VA. So this year, I will be more careful about YAN.

There are many articles and reviews already written about YAN. There is probably something about this topic in your favorite enological products catalogue. Here is a recent review from Penn State’s Enology Extension. YAN can be measured in-house if you have a spectrophotometer, but is also a relatively inexpensive analysis for the service labs to complete. As you move into harvest, it is a good idea to review your YAN targets, make sure you have a good yeast nutrient in-house and have a plan for proper addition, because timing really does matter with nutrition. There are also specialized yeast nutrients on the market to increase precursors for aroma and flavor. Some of these (especially the thiol-increasing kind) require different timing than your standard protocol, so be sure to consult the product information or the representative of the manufacturer for instructions.

When you are taking your juice samples for YAN, I recommend the following:

  1. For white and Rose wine, take your juice sample after juice clarification and racking, just prior to inoculation. Juice solids may alter the available nutrients.
  2. For red varieties, take your juice sample after any cold soaking or delay in inoculation. The activities of non-Saccharomyces yeast can alter available nutrition, so this allows for as accurate a reading as possible of the available nutrients.

In a his presentation to the Virginia Wineries Association in 2018, Ken Hurley of the Virginia Tech Analytical Services Lab Presented the following data on YAN values in Virginia.

These three graphs reveal a few important aspects of nutrient management.

  1. YAN in different every year. YAN is driven by a number of factors, including vintage variation as well as vineyard management. In discussion with Ken about YAN, he remarked that the data were more consistent per vineyard than per region or vintage. Meaning, to truly understand the YAN in your grapes, you need to test them for your own vineyard.
  2. If 140 mg/L is taken as a minimum, many of our white varieties often have sufficient YAN to complete fermentation. However, remember that fermentation security is not the only goal of proper nutrition, and most of the YAN targets will be higher based on the starting Brix of the juice as well as the conditions of fermentation. It is one thing not to starve the yeast and another to ensure they are expressing the full suite of enzymes to convert precursors into aromas. The red varieties are less likely to contain sufficient YAN to complete fermentation.

The bottom line is that it is very difficult to know based on comparisons with other years or neighboring vineyards what your YAN values are. If you want to get the most out of your fermentation, it is worth the effort and expense to test YAN and make your decisions accordingly.

Contact

Sign up for our Mailing List