Effect of Crop Load on Wine Quality

Tim Jordan, Joseph Geller, Jonathan Wheeler, and Joy Ting

May 2020

Review of Previous Crop Load Studies Why do vineyard trials always use a randomized block design? Virtual Sensory Session: Trump Crop Load Study Trump Crop Load Study (2019) Boxwood Cluster Thinning Study (2023) Stone Tower Cluster Halving Study (2023)

Don’t we already know that lower crop load leads to better wine? Maybe not always… Common inherited wisdom in viticulture says that smaller crop loads lead to better wine. Smaller crop loads are often achieved by pruning, cluster thinning, or deficit irrigation and are credited with hastening ripening, increased fruit quality, decreased disease (especially Botrytis), and better long-term vine balance. However, crop reduction comes at measurable cost. In her landmark crop load study in Oregon, Patty Skinkis estimated that a 25-50% crop reduction came a cost of $700-800 per acre. Participants in the Oregon study were cropping at 2-2.75 tons/acre on average. In Virginia, reducing premium Merlot crop from 4.5 to 3 tons/acre (as done in the Trump Crop Load trial) comes at a cost of $3750. Is it really worth it? What does this literature say? How does that apply in the vigorous soils of Virginia?

Low crop vs. High Crop load in Trump Merlot

Effect of crop load on grape and wine quality, a review

Joy Ting

May 2020

Fertile Virginia soils can sometimes lead to vigorous vine growth and high crop loads. Viticulturists commonly reduce crop load by pruning and cluster thinning to decrease shading and disease pressure, increase sunlight exposure and encourage ripening. Crop reduction is also thought to improve overall vine balance and prevent stress that can lead to lower fruitfulness in subsequent years (1). However, crop reduction comes at measurable cost. In her landmark crop load study in Oregon, where participants were routinely cropping at 2-2.75 tons/acre, Patty Skinis estimated that a 25-50% crop reduction came a cost of $700-800 per acre. In Virginia, the commercial cost of reducing premium Merlot crop from 4.5 to 3 tons/acre (as done in the Trump Crop Load trial) averages over $3750 (2). The question then arises: how much crop should be dropped to achieve ripeness and quality? Are we thinning too much or not enough? What is the right balance, for the vine as well as the bank account?

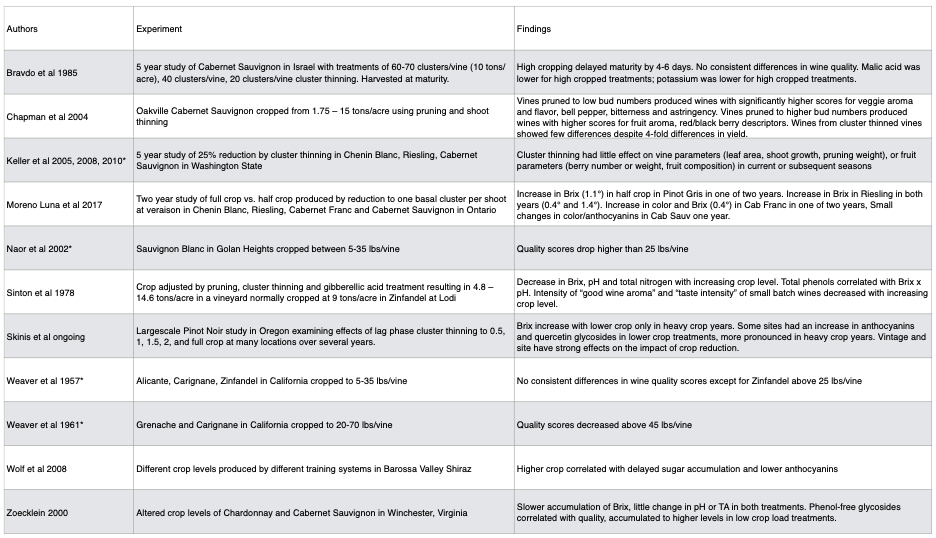
Previous studies examining the effect of altered crop load in different regions with different grape varieties have shown markedly mixed results. Some studies (3–5) find important differences with crop reduction including faster maturity, better color, higher anthocyanins, and higher wine quality scores while others find little to no differences at all (1,6,7). Some even report decreases in wine quality with lower crop level as negative flavor and aromas such as methoxypyrazine are concentrated (8) The attached report summarizes outcomes from many crop load studies. Interpretation of these studies is complicated by the differences in growing region, grape variety, and whether grapes were harvested on the same day or at the same level of maturity. Moreno Luna et al (2017)(1) studied both crop level and harvest date and conclude that differences between crop load treatments could be overcome with longer hang time, however in some regions (like Virginia), longer time includes greater risk of precipitation and disease. The method of crop management may also matter, with pruning more effective than crop thinning (8). Some studies find few differences until very high crop loads are reached (7,8). Many studies report vine phenology and grape chemistry but do not include examination of flavor and aroma of wine, either chemically or by sensory analysis. 

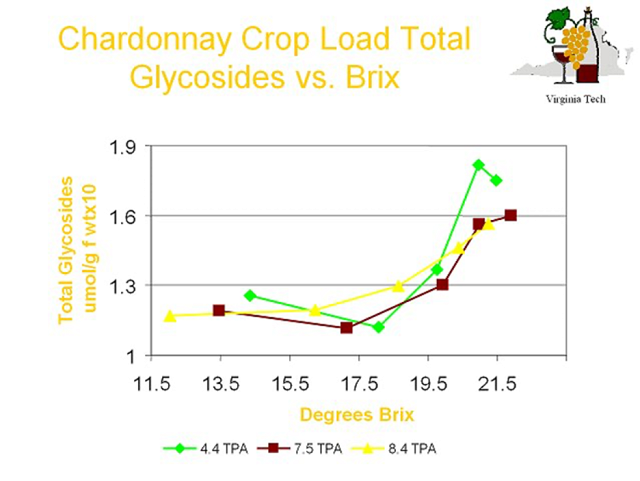
Figure 2: Lower crop load leads to greater accumulation of total glycosides over time. From Zoecklein (2000)

In a presentation to the Virginia Vineyards Association in 2000, Dr. Bruce Zoecklein of Virginia Tech presented data examining the relationship between yield and wine quality in Chardonnay and Cabernet Sauvignon in Winchester, Virginia (9). In addition to Brix, pH and TA, these studies included a measure of phenol-free glycosides, the pool of secondary metabolites that will be transformed into flavor and aroma in the wine. In Chardonnay cropped to 3.7, 7.3, and 10.2 tons/acre on an open lyre system, higher crop load led to decreased Brix with little change in pH or TA. The lower crop load treatment also had significantly higher total glycosides, which were correlated with wine quality through sensory analysis. When total glycosides were measured at different Brix levels during ripening, they were relatively the same for each crop load relative to Brix until grapes accumulated 20.5°Brix, at which point the lower crop load (4.4 tons/acre in this case) had notably higher accumulation of these metabolites. This relationship was shown to continue to diverge as Brix increased to 24.5°Brix. A similar study of in Cabernet Sauvignon harvested at 20.5°Brix showed differences in phenol-free glycosides between crop loads of 7.4 tons/acre and 10.4 tons/acre with the lower crop load again accumulating a larger pool of potential flavor/aroma compounds. In both Chardonnay and Cabernet Sauvignon, wines with higher phenol-free glycosides were perceived to be different in sensory analysis. These results underscore the fact that general grape chemistry (Brix, pH, TA) does not always fully describe the quality potential of the grapes.

When taken as a whole, the literature suggests that for any given situation, there is a range of crop load that will produce comparable quality wine, with lower quality wine produced when crop load is too high or too low. The most cost effective management strategy, then, would be to maintain the vineyard on the higher end of the range of comparable quality. Unfortunately, given the large ranges examined in the literature with differing results, there is no clear formula to determine the right amount of crop to grow on a given site. These values depend on factors such as vine vigor, leaf area, vintage, variety, water availability, length of the growing season and many others (3,4,7,8) In concluding his presentation on crop load, Zoecklein said

The relationships between yield and quality are complex...There may be no exact point when overcropping begins (9).

 The best approach to determine the right crop load for a given vineyard then is by practical experimentation.

...despite over 50 years of research investigating cluster thinning, crop size, and yield effects on vine physiology, vine size, yield components, berry composition, and wine composition and quality, there are many contradictions in the literature due to the cultivars chosen for experimentation and the circumstances under which each trial was carried out. (Luna et al, 2017)

The Oregon Statewide Crop Load Study

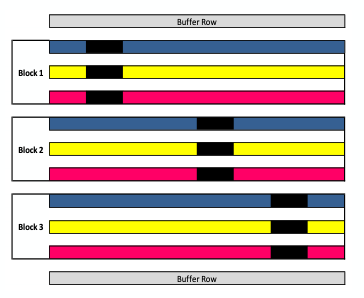
An impressive example of how to set up a practical experiment examining the effect of crop load on fruit and wine quality comes from the Statewide Crop Load Study conducted by Dr. Patty Skinkis of Oregon State University (7). This ongoing 10-year study (currently in year 8) has included 24 different companies across 6 AVA’s examining the effect of crop load on Oregon Pinot Noir. At each site, a randomized complete block design was used to test the effect of two or more crop levels determined by the practitioner, with three replicates per site. Crop levels were imposed as cluster thinning to 0.5, 1, 1.5, and 2 clusters per shoot as well as no reduction in clusters per shoot. Standardized sampling protocols from 10-vine sections were followed by all participants with data collected for vine phenology, yield and fruit composition (7).  Data collected so far indicate that there is considerable difference in yield per treatment each year, but differences in Brix have been seen only in high crop years. Few differences have been observed for pH, TA, or total phenolics based on yield (7). 


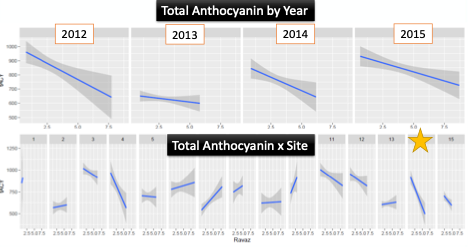
Figure 3 Anthocyanins across 15 sites in the Oregon Statewide Crop Load Study, from Skinkis 2017

The most consistent differences have been seen with 10-40% higher levels of anthocyanins in lower crop treatments in high crop load years, but even these are not seen at most sites. This change in anthocyanins might be due to physiological causes or those due to microclimate (fewer overlapping clusters). Quercetin glycoside, a phenolic molecule used by the grape as sunscreen, also differs with anthocyanins, indicating the differences in anthocyanin concentration may be due to shading more than vine physiology. Preliminary conclusions to this study indicate that the site and vintage have a higher impact on quality than yield, and that Oregon growers may be able to sustain higher crop loads than the current standard of 2-2.7 tons/acre with little loss in quality (7,10–12). 

The strengths of the Oregon study are many:

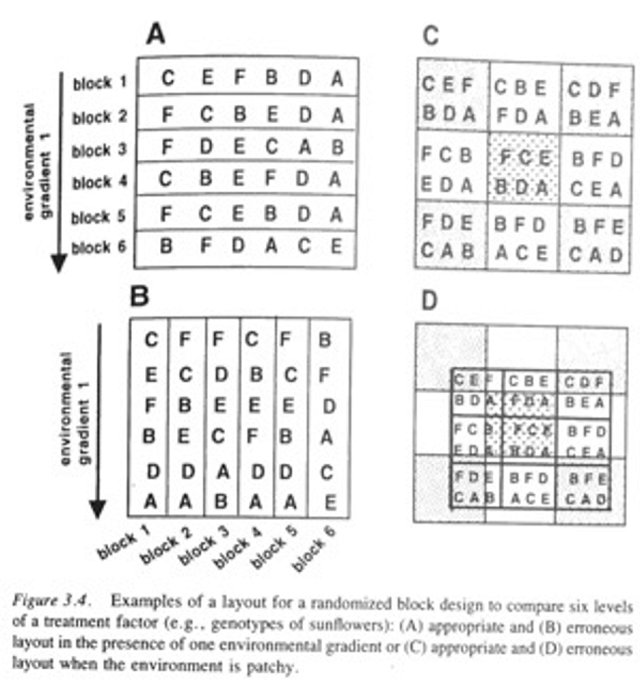
  • The randomized complete block design accounts for vineyard variation and allows for more efficient statistical analysis.
  • A standardized experimental design and sampling protocol allows for a broader application of the experimental results beyond a single vineyard.
  • The practicality of the sampling regime (a 10-vine area) is not too complicated for practical application.

Virginia has higher vigor than Oregon, indicating that the trends seen during “high yield” years in Oregon may be seen more consistently in Virginia. The Skinkis study provides a roadmap for experimental design that can be applied to Virginia vineyards with potential impacts on grape and wine quality as well as cost of wine production. The crop load study done at Trump Winery in 2019 followed an adapted version of this protocol.


 References

(1) Moreno Luna, L. H.; Reynolds, A. G.; Di Profio, F. Crop Level and Harvest Date Impact Composition of Four Ontario Winegrape Cultivars. I. Yield, Fruit, and Wine Composition. American Journal of Enology and Viticulture 2017, 68 (4), 431–446. 

(2) SMS Research Advisors. 2019 Virginia Commercial Grape Report. 2020.

(3) Bravdo, B.; Hepner, Y.; Loinger, C.; Cohen, S.; Tabacman, H. Effect of Crop Level and Crop Load on Growth, Yield, Must and Wine Composition, and Quality of Cabernet Sauvignon. Am J Enol Vitic. 1985, 36 (2), 125–131.

(4) Wolf, T. K. Wine Grape Production Guide for Eastern North America; Plant and Life Sciences Publishing: Ithaca, New York, 2008.

(5) Sinton, T. H.; Ough, C. S.; Kissler, J. J.; Kasimatis, A. N. Grape Juice Indicators for Prediction of Potential Wine Quality. I. Relationship Between Crop Level, Juice and Wine Composition, and Wine Sensory Ratings and Scores. Am J Enol Vitic. 1978, 29 (4), 267–271.

(6) Matthews, M. A. Terroir and Other Myths of Winegrowing; University of California Press: Oakland, California, 2015.

(7) Skinkis, P. The Low Down on High Yields: Challenging Yield-Quality Standards for Oregon Pinot Noir, 2017.

(8) Chapman, D. M.; Matthews, M. A.; Guinard, J.-X. Sensory Attributes of Cabernet Sauvignon Wines Made from Vines with Different Crop Yields. Am J Enol Vitic. 2004, 55 (4), 325–334.

(9) Zoecklein, B. W. Update of Ongoing Projects, 2000.

(10) Skinkis, P. Pinot Noir Crop Load Wine Technical Tasting Challenges the Yield-Quality Relationship. Oregon State University Vine to Wine 2020.

(11) Skinkis, P.; Schreiner, R. P. Defining Crop Load Metrics for Quality Pinot Noir Production in Oregon; Unified Grant Management for Viticulture and Enology Interim Report Summary; 2016.

(12)  Uzes, D. M.; Skinkis, P. A. Factors Influencing Yield Management of Pinot Noir Vineyards in Oregon. Journal of Extension 2016, 54 (3).

Download Report

Randomized Complete Block Design for Vineyard Experiments

Joy Ting

May 2020

Vineyards are variable places. We think about this when it is time to select a site, decide which varieties get planted where, how to fertilize or what (if anything) to grow between the rows. It is also crucial to consider the variation in the vineyard when setting up a vineyard trial or doing fruit sampling. Data analysis and interpretation are only as accurate as good experimental design allows, so it is crucial to consider the scale of each treatment and the physical and temporal plan for sampling before starting. 

The main issue when setting up a vineyard trial is minimizing the differences  between treatemens that are due to environmental effects in order to be able to recognize any differences that are due to the treatment itself (1). The solution to this challenge is replication, both in the treatment regime and in the sampling regime. If the treatment is applied in multiple places in the vineyard and shows the same effect each time, it is more likely that effect is due to treatment than simply because it occurred in a particular location in the vineyard. 

Figure 1 from The Low Down on High Yields, Skinkis, 2017

The randomized complete block design is a common method for setting up trials in the vineyard. Three main components contribute to the strength of this approach: blocking, randomization and replication (1).

A “block” is a defined, relatively homogenous region of the vineyard that is subdivided to receive each level of treatment. Several blocks are identified within the vineyard as replicates, with each block receiving each treatment level. Within each block which region receives which treatment is assigned randomly. Randomization reduces the bias that would be introduced by having a pattern of assignment. 

When setting up the blocks, it is important to take the overall layout of the vineyard into consideration. The size and location of each block is determined by the level of environmental heterogeneity. Heterogeneity within the block should be very low while between block heterogeneity can be large. For example, a vineyard located on a slope should have a block that contains each treatment on the top and another block at the bottom of that slope rather than treatment at the top and control at the bottom. Figure 3.4 from Design and analysis of Ecological Experiments(1) provides a good visualization of these issues. 

Figure 2 from Design and Analysis of Ecological Experiments, Scheiner, 1993

Another level of variation occurs during sampling. Any time a vineyard is sampled, there are a range of values that could found based on the variation that is present in that vineyard. Within a single grape cluster there can be berries with a wide range of sugar values, so it is unlikely a single berry can be chosen to represent the whole cluster. To narrow the value as close to the actual value as possible, good sampling must be practiced. This includes taking care to collect a representative sample, avoiding the biases of picking the most obvious or most attractive fruit. Many guides are available to ensure samples come from different locations on the vine and different locations on the cluster (2–4). However, sampling can also be in error due to environmental variation. Replicated sampling within a block (at the near, middle, and far portion of a row, for example) can help tease out variation due to location vs. variation due to treatment level. A key element to keep in mind while sampling for a vineyard trial is that the sample is not meant to determine the overall level of any metric for the whole vineyard, but rather it is meant to minimize environmental variation to determine differences due the treatment level. Individual sampling at multiple places sum together to determine if these changes are consistent throughout the vineyard. 

By carefully selecting treatment blocks placed at multiple sites within the vineyard, and collecting replicate samples within a block, statistical analysis can then be used to separate  which portion of the variation is due to the block location, the treatment level, and just random chance (1). Setting up the vineyard experiment with these elements allows much more clear interpretation of the data and a much better chance of accurately identifying treatment effects.


References:

(1) Design and Analysis of Ecological Experiments; Scheiner, S. M., Ed.; Chapman and Hall, Inc: New York, 1993.

(2) Zoecklein, B. W. Grape Sampling and Maturity Evaluation for Growers https://www.apps.fst.vt.edu/extension/enology/VC/Jan-Feb01.html (accessed Oct 30, 2019).

(3) Wolf, T. K. Wine Grape Produciton Guide for Eastern North America; Plant and Life Sciences Publishing: Ithaca, New York, 2008.

(4) Amerine, M.; Rossler, E. B. Field Testing of Grape Maturity. Hilgardia 28 (4), 93–114.

Virtual Sensory Session: Effect of Crop Load on Wine Quality in Merlot

Jonathan Wheeler and Joseph Geller

Trump Winery

In 2019, the team at Trump Winery conducted a study of the Effect of Merlot Crop Load on Grape and Wine Quality. With the assistance of Dr. Tim Jordan, they set up replicated blocks within the vineyard and took an impressive amount of data to try to understand if wine quality in this Merlot vineyard is affected by altering crop load from 4.5 to 3 tons/acre. On April 30, 2020 we met virtually to discuss this study and to collect sensory data from our remote participants. 

Watch Video Here

Trump Crop Load Study (2019)

Effect of Merlot Crop Load on Grape and Wine Quality in a Virginia Vineyard (2019)

Joseph Geller, Jonathan Wheeler, Dr. Tim Jordan

TRUMP WINERY

___________

Summary

Common inherited wisdom in viticulture says that smaller crop loads lead to better wine. However, most of the published reports on crop load were done in widely varying ranges (from 4-12 ton/acre) and in regions other than Virginia. Crop thinning as little as 1.5 tons/acre comes at considerable cost. In this study, crop thinning to a target of 3 vs. 4.5 tons/acre was done on the Merlot block of the Chateau vineyard of Trump Winery in a randomized complete block design. This resulted in significantly different crop load, with no significant difference in ripening parameters (Brix, pH, TA) or berry weight. Grape and wine color metrics were higher for the low crop treatment, however these were not significantly different in sensory analysis. Virginia has a wide range of variation between vintages, and vines may be able to carry more crop in warm, dry vintages such as 2019 while the results maybe different in cool, wet vintages such as 2018. Plans are to repeat this study in subsequent vintages.

Click here to read the full report.


Boxwood Cluster Thinning Study (2023)

Exploring the effect of shoulder thinning in Cabernet Franc (2023)

Joyce and Stephen Rigby

BOXWOOD WINERY

___________

Summary

Rich mouthfeel is a hallmark of quality red wine. The mouthfeel of a wine is influenced by its astringency, fruit concentration, alcohol content, and acidity. Both astringency and fruit concentration are a function of grape quality and maturity and are difficult to correct in the winery. At Boxwood, vines are planted in closely spaced vines and rows, with judicious crop thinning to fewer than 12 clusters per vine. The purpose of this experiment was to determine if removing the shoulders of the remaining clusters would lead to improved mouthfeel in the finished wine. A single block of Cabernet Franc clone 214 on 101-14 rootstock was divided into six sections of three rows each. All sections were thinned according to the standard protocol. In three of the six sections, shoulders were removed from the remaining clusters. Fruit samples were collected from each replicate just prior to harvest. Three treatment replicates were combined in a single harvest lot to produce production scale wine. There were no differences in fruit chemistry, berry weight, or cluster weight between treatments at harvest. Anthocyanin and tannin concentrations were higher in samples from fruit with shoulders removed, but this difference was not found in the finished wine. The wines were not different in a triangle test, and there were no significant differences in descriptive scores for fruit intensity, fruit character, herbaceous/green character, nor the intensity of astringency. When asked to compare the feeling of astringency to the tactile sensation of 4 different fabric standards, the wine produced from shoulder-thinned fruit was most often described as having suede-like tannin texture while the astringency of wine made from fruit with standard thinning was most often described as “sandpaper”.

Click here to read the full report. 


Stone Tower Cluster Halving Study (2023)

Does the timing of cluster halving impact grape and wine quality in Nebbiolo? (2023)

Preston Thomas

STONE TOWER WINERY

___________

Summary

Stone Tower Winery has several acres of Nebbiolo that is used to produce a varietal wine. Without judicious crop thinning, these vines produce a heavy crop load with very large clusters. Typically, the crop is thinned at veraison by removing roughly half of each cluster, allowing better cluster morphology and, presumably, more even ripening. However, this comes at considerable cost in labor and yield. The purpose of this experiment was to (1) validate the efficacy of cluster halving and (2) test the impact of this treatment at two time points (post fruit set vs veraison). Three long rows of Nebbiolo were treated as control (no thinning), T1 (thinning by cluster halving between fruit set and bunch closure) and T2 (thinning by cluster halving at veraison). Fruit chemistry during ripening was very similar between early vs. late thinned fruit. Control fruit lagged behind with higher berry weight, lower Brix, and lower pH at two sampling dates. Finished wine chemistry was also very similar between the two treatments. Both had indications of riper fruit than the control, such as higher alcohol, higher pH and lower TA. Both treatment wines also had higher concentration of anthocyanins and phenolics, but lower tannin, than the control wine. The control wine and T2 (later thinning) wines had very similar sensory scores. The wine produced from early thinned fruit had significantly higher sensory scores for color intensity, hue, and fruit intensity. Early fruit thinning resulted in 22% lower yield while later thinning resulted in 37% lower yield than control. In this case, lower yield correlated with advanced ripening in both treatments and improved sensory results in the early thinned treatment.

Click here to read the full report.

Contact

Sign up for our Mailing List