Testing the tests: a survey of accuracy and precision of juice chemistry analysis at Virginia service labs (2021)
Rick Tagg
Delaplane Cellars
Introduction
Most small wineries in Virginia have the ability to measure Brix, pH, and perhaps TA in-house, but rely on service labs to test malic acid, acetic acid and YAN. There are several service labs to choose from, each offering different juice panel metrics, pricing, and turnaround times. Costs range from $50 to $120 depending on the lab and tests offered. All panels include Brix, pH, TA, malic acid, and YAN. Some also include additional metrics such as VA, potassium, and glucose/fructose. Volume discounts are also offered by some labs, depending on overall volume or volume of samples received in a single day. Single-day discounts often account for the added time and supplies needed to set up calibration curves.
Some wineries have labs nearby that allow for local drop-off of samples, but many require shipping. It is more difficult to ship juice samples than wine samples because juice may start to ferment during transit, leading to changes in nearly all juice parameters. Whether shipping or delivering, preparing samples and getting them out to the lab can be a challenge during busy harvest days, especially for wineries located in remote areas.
Winemakers who send samples to an outside lab occasionally see results that either do not match their in-house values or are out of the normal range seen for a given variety or vineyard, leaving questions about the true values, sources of error, and resulting winemaking decisions.
The purpose of this experiment was to survey the accuracy and precision of three Virginia-based service labs for a better understanding of how to interpret lab results. ETS (St. Helena, CA) was used as a control because they are often considered the gold standard in laboratory testing.
Many metrics can be used by service labs for validation1. Accuracy measures how close a measurement is to the true value while precision indicates how close multiple measurements of the same item are to one another. Ideally, all labs would be both precise and accurate. The coefficient of variation (CV) is a measure of precision calculated from the standard deviation divided by the average value. In essence, it reports the percentage spread of the data. Low values for standard deviation (SD) and CV indicate high precision while high values of these metrics indicate the data are spread widely.
Methods
Twelve tubes of Chardonnay juice from the same tank were collected after cold settling. Four sets of three tubes were labeled with different descriptions, then sent to three different Virginia-based service labs as well as ETS for juice analysis. For consistency, all samples were frozen before shipping. Cold pack shippers and ice packs were used for shipping.
Results
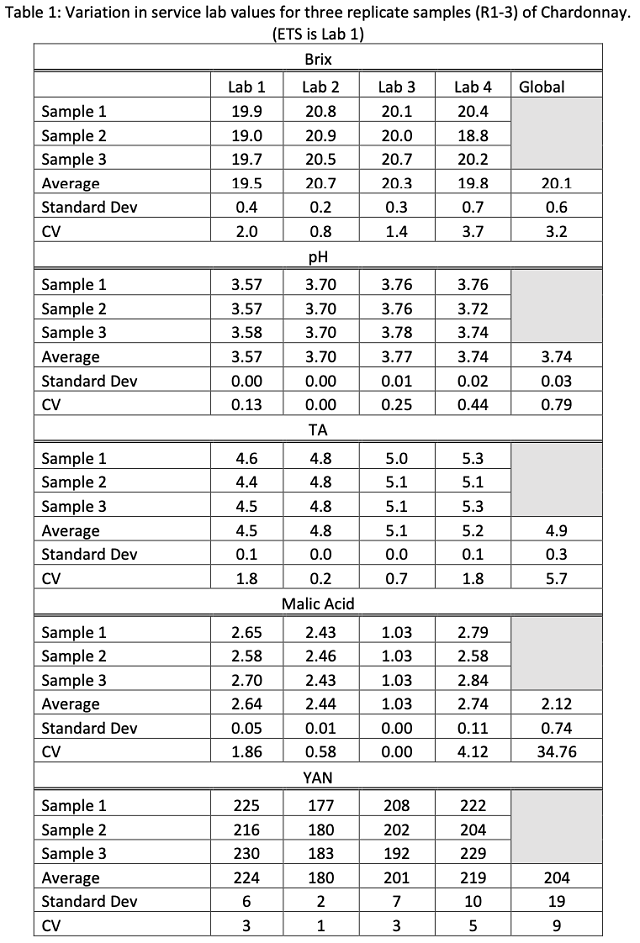
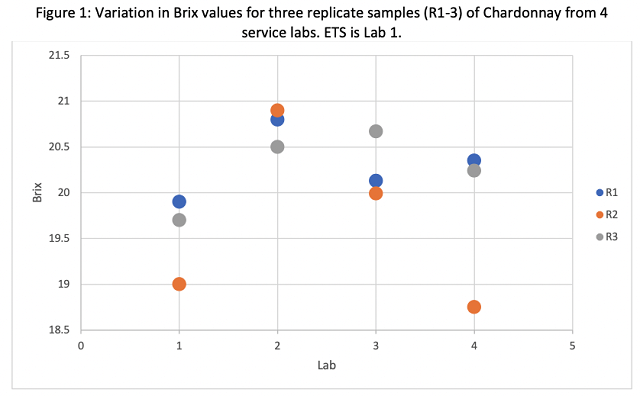
Reported Brix values ranged from 18.8 – 20.9 across all labs (Table 1). This included a range of 19.0 – 19.9 from ETS (Lab 1) and 18.8 – 20.4 at Lab 4. The most likely reason for such a large spread of data is that some of the samples began to ferment during transit. A difference of 2° Brix may lead to differences in chaptalization rate and is therefore meaningful to the winemaker. All winemakers should have a reliable measure of Brix in-house to avoid the effect of fermentation in transit. To ensure the most reliable in-house Brix measurement, proper cleaning, calibration and temperature correction should be employed2.
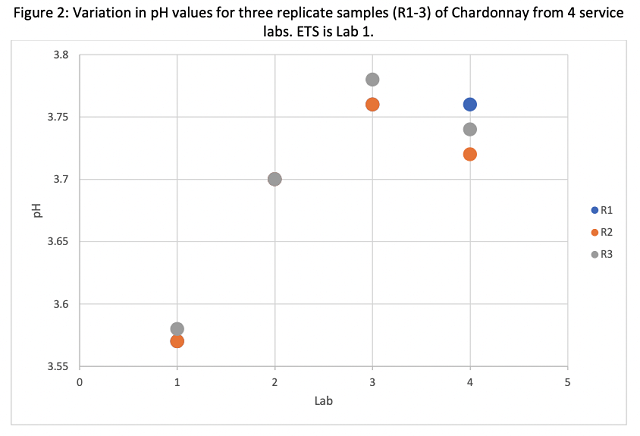
Reported pH values ranged from 3.57 – 3.78 across all labs (Table 1), however these values were not evenly distributed. All values from ETS were lower than values from any other lab (Figure 2). It is expected that freezing juice, as was done in this study, would increase pH values due to precipitation of potassium bitartrate. ETS awas contacted to determine if there was a difference in analysis for frozen juice that accounted for the differences in pH values reported. Rich DeScenzo (personal communication) indicated that frozen juice samples are thawed to room temperature then briefly boiled in the microwave for 2-3 seconds to melt any potassium bitartrate crystals that might have formed during freezing, which returns tartaric acid to solution and lowers pH. It is highly encouraged to mark samples as frozen in order to allow the lab to make this adjustment. Also, use of fresh samples is always better than frozen if possible.
pH is a primary indicator of the antimicrobial properties of the juice. Differences in pH due to transit methods illustrates the need for all winemakers to have a reliable pH meter in-house, properly calibrated and maintained, especially during harvest. The pH meter not only determines the pH values but also contributes to measurement of TA and outcomes of acid trials. A good pH meter will measure to 0.01 pH units, and properly maintained, should last several years before probe replacement. A meter of this kind is readily available for $400-700.
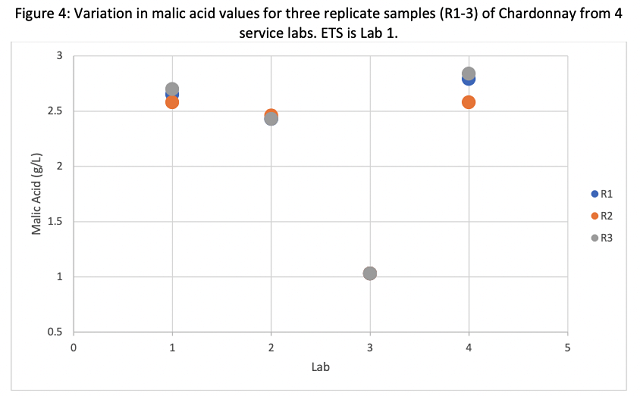
Three of the four labs reported malic acid values clustering from 2.43 to 2.84 g/L, however Lab 3 reported three values of 1.03 g/L. The fact that all three values were this low indicates either an error in testing this metric or an error in reporting. Most winemakers test malic acid to determine completion and subsequent SO2 addition. Though a difference between 2.5 and 1.03 would not have changed this, it might have caused a winemaker to think malolactic conversion was happening when it was not. Unlike in-house labs, service labs do not have the benefit of historical data for comparison. In an in-house lab, a value less than 50% of expected would trigger a re-test. If a service lab reports a value that is aberrant to the norm, the winemaker should request the sample be tested again. If the first was in error, the lab will usually not charge for the re-test.
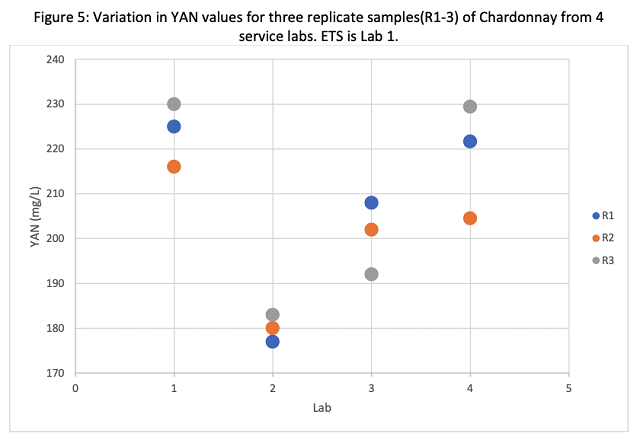
YAN values ranged from 177 mg/L to 230 mg/L. Here, Lab 2 underreported values relative to the other labs (Figure 5). This metric is the main reason wineries send juice samples for analysis, and a difference of this magnitude would likely lead to a different decision for yeast nutrition. For example, according to the Scottlabs nutrition schedule, an average value of 180 mg/L (reported by Lab 2) would warrant active nutrition for yeast with moderate nutritional needs while 224 mg/L (as reported by ETS) would not warrant nutrient additions in most cases. YAN values also had a larger range within labs, with Lab 4 alone reporting values from 204 to 222 on different replicates of the same juice. Nitrogen is taken up very early in the activity of yeast, so if juice thawed during shipping, YAN values may change quickly.
Taken as a whole, these results lead to a few recommendations:
-
Whenever possible, measure Brix, pH, and TA in house on a calibrated pH meter. These tests are inexpensive to set up and will give the winemaker confidence when making decisions about chaptalization and acidulation. Run a standard in-house to test your calibration. There is a protocol for pH meter calibration on the WRE website. A good standard is a supersaturated solution of cream of tartar, which will always read 3.55.
-
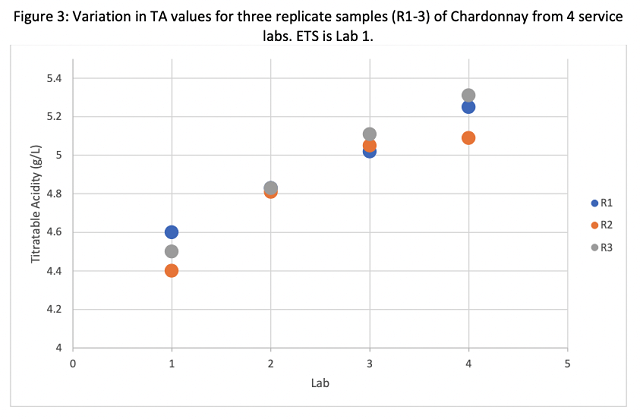
If you send samples out, compare the service lab values for Brix, pH, and TA with in-house values to double check for errors on either side. If juice has begun to ferment, causing YAN values to fall, it is likely TA will be elevated (by CO2 from fermentation) and Brix will be low.
-
Always compare values to expected norms from historical data and context. If a value reported by a lab does not fit your expectations, ask them to re-run the sample.
-
Be aware of the range of values inherent in the test itself and make your winemaking decisions accordingly. No test is perfect. You are really aiming your additions at a range.
References
(1) Howe, P. A.; Ebeler, S. E.; Sacks, G. L. Review of Thirteen Years of CTS Winery Laboratory Collaborative Data. American Journal of Enology and Viticulture 2015, 66 (3), 321–339.
(2) Iland, P.; Bruer, N.; Edwards, G.; Weeks, S.; Wilkes, E. Chemical Analysis of Grapes and Wine; Patrick Iland Wine Promotions PTY LTD: Campbelltown, Australia, 2004.
