High pH and Acid Adjustments
Some vintages bring higher than normal pH values, even at lower brix levels. Following is a brief review of the concepts of acid and pH which may help inform winemaking decisions regarding acidity and acid adjustments.

Figure 1: Structure of Tartaric Acid
The predominant acids in juice that contribute to acidity are tartaric acid and malic acid. There are others present in smaller amounts, such as citric acid, that can contribute to the flavor profile later, but, the effect on acidity is mainly due to tartaric and malic. Acids are defined as molecules that will will dissociate a proton in aqueous solution. “Strong” acids fully dissociate, so that all acid molecules have given up a proton, while “weak” acids are in an equilibrium where some molecules have dissociated and others have not. Both tartaric and malic acids are weak acids.

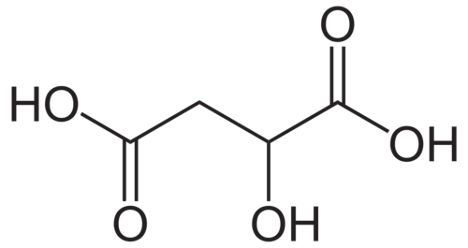
Figure 2: Structure of Malic Acid
In the wine lab, two measurements are routinely taken to assess the acidity of the juice or wine: pH and TA. TA is a measure of how many protons have been given up when titrated with base up to pH = 8.2. Tartaric acid will give up two protons at this pH and malic acid will give up one. The TA contributes to the acid flavor of the wine, and different acids have different effects on the sensory characteristics (malic acid vs. lactic acid). Generally TA of finished wine ranges from 5.5 - 8.5 g/L.
pH is a measure of the hydrogen ions currently in solution. It is sometimes referred to as acid strength. The pH scale is both inverse (a solution at pH = 3.0 has more hydrogen ions than a solution at pH = 4.0) and logarithmic (there are 10 times more hydrogen ions at pH = 3.0 than at pH = 4.0). Generally, white wines fall in a pH range of 3.1 - 3.4 and red wines fall in a range of 3.4 to 3.8.
The pH of a wine is important because it affects the microbial stability of the wine, the efficacy of SO2, and the color of red wine. Some spoilage microbes are inhibited by lower pH (Brettanomyces is less active at pH<3.8, though this does not fully prohibit Brett infection). A larger proportion of SO2 is in its molecular (anti-microbial) form at lower pH. For example, to achieve a molecular SO2 of 0.8 mg/L, one would need 40 ppm free SO2 at a pH of 3.5, but 79 ppm at a pH of 3.8. Low pH also shifts the equilibrium of anthocyanin molecules from the colorless state to a red pigment (10% are colored at pH = 4 while 20-25% are colored at pH = 3.4-3.6).
Though tartaric acid and malic acid contribute protons to solution, thus lowering pH, the relationship between TA and pH is not linear because of several factors. Cells of living organisms must remain within limited pH range to sustain all the reactions needed for life, so they contain molecules that will buffer acid/base changes. These molecules will take up or give up protons based on the current situation. This means that not all acid added to the solution directly contributes to pH. It depends on the buffering capacity. Buffering capacity can be different depending on growing conditions, grape cultivar, and overall health of the grapes.
A general rule of thumb is that 1 g/L of added tartaric acid will lower pH by 0.1. However, the best way to determine the effect of acid addition in your juice is to do a bench trial with sequential additions of concentrated tartaric acid and record the change in pH. If you would like a written protocol for this, please contact me directly.
Role of potassium
One of the most common questions so far this year is whether or not a wine will hold onto acid once it is added. This has a lot to do with the possum level in the juice/wine. Potassium comes up through the roots of the plant and is actively transported into the grape berry in exchange for protons. Potassium uptake is increased by shading in the berry, and by warmer temperatures. Since it is carried by water as it comes into the plant, rainy seasons lead to more potassium in the grapes. Since potassium enters the grape in exchange for hydrogen ions, the more potassium there is available to the plant, the lower the proton concentration (and higher pH) in the berry. This, coupled with warm nights consuming malic acid, is likely a major factor leading to the high pH in grapes this year.
Potassium also plays a role in acid addition to juice and wine. When tartaric acid is added, some of the tartaric acid will bind with potassium to form potassium bitartrate (KHT). When KHT reaches saturation, it will precipitate out of the wine. This process is what is occurring during cold stabilization, essentially removing tartrates before they form in the bottle. When KHT precipitates, it will lower the pH if it occurs below pH = 3.6, but if it occurs above pH = 4.0, it will raise the pH. (The effect between 3.6 and 4.0 depends on the buffer capacity of the wine.) KHT is more soluble in juice than in wine, so the overall effect of acid addition may change during aging as KHT forms in cold cellars over the winter. This means that when you do tartaric additions, it is likely some of that tartaric will precipitate out as KHT. However, when that happens, the potassium is taken out of solution and subsequent additions will be more likely to remain in solution. So, you may need to do multiple acid additions, but you should get better retention each time.
Winemaking considerations
What do you do in high pH years? There is no one answer to this question, but here are a few suggestions:
(1) Keep in mind targets that you are comfortable for in terms of stability and aging. It is unlikely you will reach your ideal numbers, so set a reasonable target.
(2) Harvest earlier and chaptalize if the fruit tastes ripe.
(3) Add tartaric acid at the juice stage to help with microbial selection and color stability. Once anthocyanin bind to tannins, their form (colorless or red) is fixed.
(4) Some yeast strains will consume malic acid during fermentation. Avoid using these strains on wines not meant for malolactic fermentation. (Your manufacturer should be able to tell you if your yeast falls into this category)
(5) Do bench trials of acid additions to determine how much addition is needed to achieve targets. You can also set up taste trials of various additions. Due to buffering capacity, the "norm" of 1 g/L = 0.1 pH point may not hold.
(6) On white wines, think carefully if you want to undergo malolactic fermentation, which will likely shift pH even higher.
References
Zoecklein (2000), Enology Notes #6
Zoecklein et al (1995) Wine Analysis and Production, p 76-83
Boulton et al (1997), Principles and Practices of Winemaking, p 233, 258, 449-451, 534
