Harvest Decisions Based on Grape Phenolic Development (Enartis) (2017)
Submitted by Matthieu Finot
King Family Vineyards
Summary
This study examines the ability to judge when grapes are harvest-ready by monitoring phenolic development over time. Cabernet Franc grapes began being sampled weekly starting on September 1 for a number of chemical and phenolic parameters. Enartis then made a harvest recommendation for September 22 (First Pick) based on comparing phenolic and chemical profiles over time. This decision was based on declining anthocyanin and phenolic values occurring in the grapes, with a desire to pick while these values were near their peak. The winemaker monitored grapes based on in-house chemistry values, seed coloration, and hang time, and picked another portion of the block on October 4 (Second Pick). Because the chemistry was different between juices, the second pick juice received more tartaric and malic acid additions. All other treatments were the same, except for a possible non-addition of Lafase HE Grand Cru to the second pick must. Wines were pressed off after 18-19 days. Grape ripening tended to follow classic ripening curves, exhibiting increasing Brix and a positive sigmoidal pH ripening curve. Average berry weight and water content peaked and then declined, due to dehydration. Phenolic content tended to peak and decline as well, and this occurred after the berry weight and water content began to decline. The first pick, based on phenolic ripeness, had lower alcohol. The differences in lactic acid may have been due to different malic acid additions between treatments. The first pick wine had slightly higher tannin and anthocyanin and much higher quercetin glycosides, but slightly lower color. However, this wine received Lafase HE Grand Cru, whereas the second pick wine may not have received this enzyme. This may have altered the results in this regard. Overall, sensory analysis suggests that these wines were significantly different. There tended to be a preference for the earlier picked wine, but this preference was tasting-dependent. Descriptive analysis was inconsistent between tastings, and no conclusions can be drawn with regard to this. Due to this inconsistency, this study should be repeated multiple times to help gauge the impact of picking based on phenolic parameters on sensory qualities in wine. Additionally, the use of Lafase HE Grand Cru in one wine and perhaps not in the other could have further confounded these results, suggesting that this study should be repeated. However, the idea behind this technique of monitoring ripening may serve to be a useful guide to picking in Virginia, to harvest while phenolic levels are maximized before they begin to decrease.
Introduction
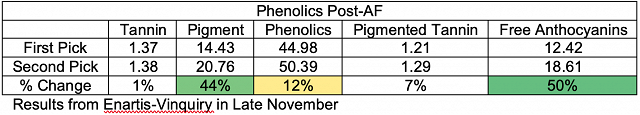
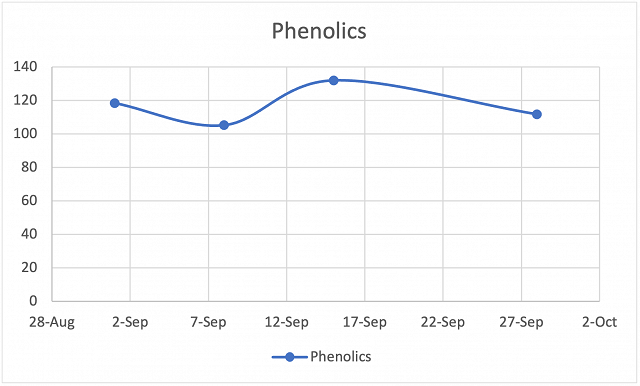
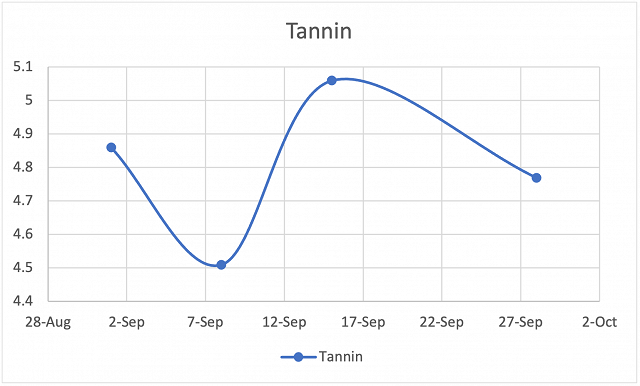
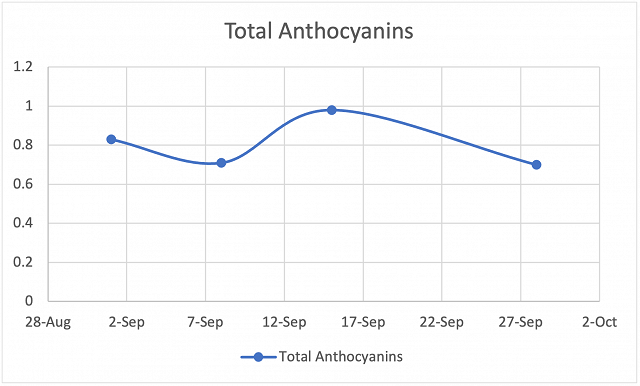
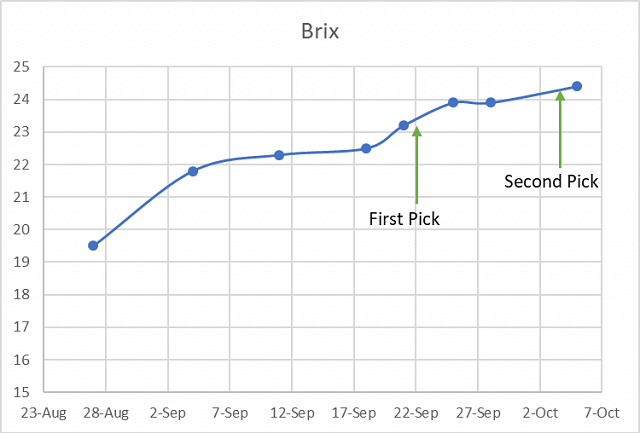
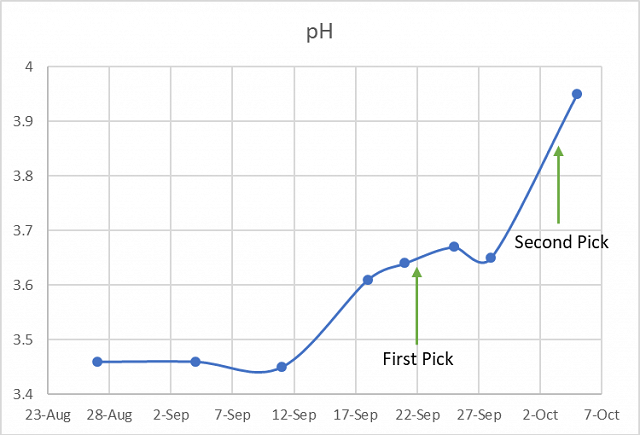
Harvest decisions are based on a number of parameters, but primarily by monitoring the development of acidity and sugar in grape berries. Brix, however, may not necessarily correlate to phenolic ripeness or to aromatic ripeness. Although Brix and pH tend to increase as grapes ripen, phenolic parameters tend to exhibit a plateau before declining after further hang time (Enartis, personal communication). Often, the total level of tannin in the grape hypodermis stays the same in quantity but decreases in concentration as the grape berries grow. Anthocyanins often peak and then decrease over time. Seen tannin tends to decrease during ripening, possibly due to binding to the insoluble seed matrix (Adams 2006). Thus, when all phenolics are monitored together, a plateau followed by a decline may be observed during ripening. Therefore, monitoring phenolic levels and harvesting grapes right when they peak may serve as a useful ripeness parameter in grapes. This study, done in collaboration with Enartis, monitors grape ripening based on traditional parameters as well as against phenolic parameters, and harvests twice based on each parameter.
Results and Discussion
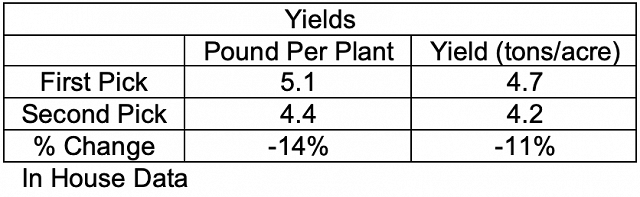
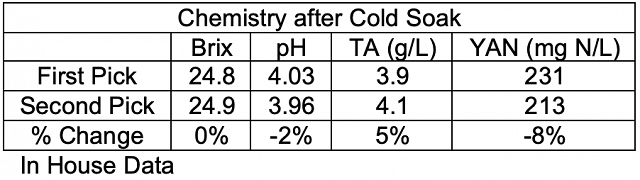
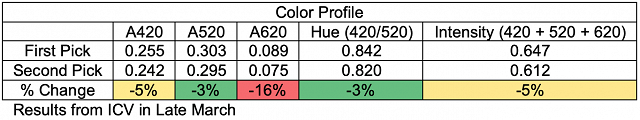
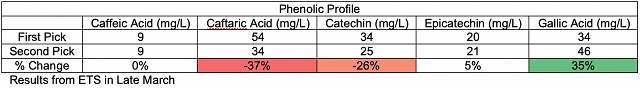
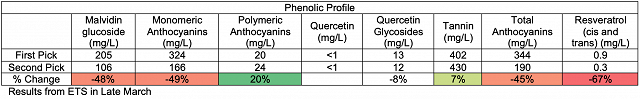
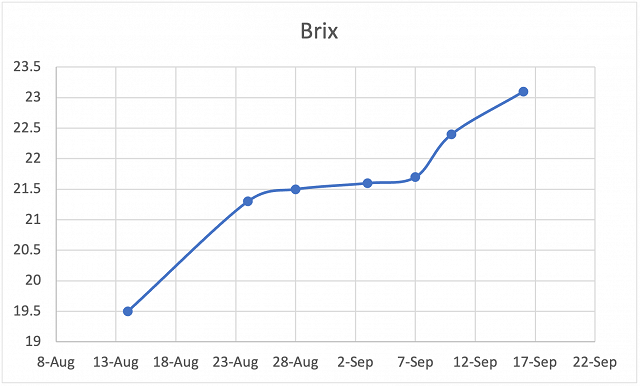
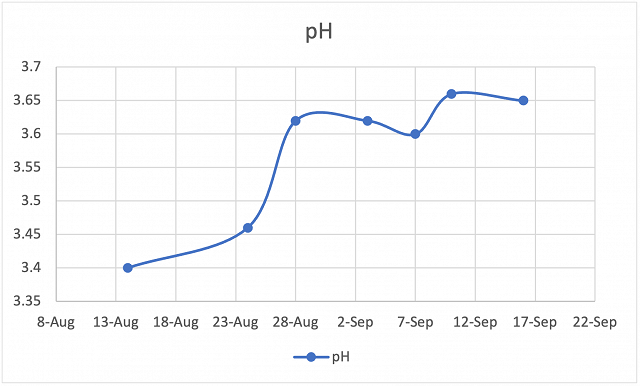
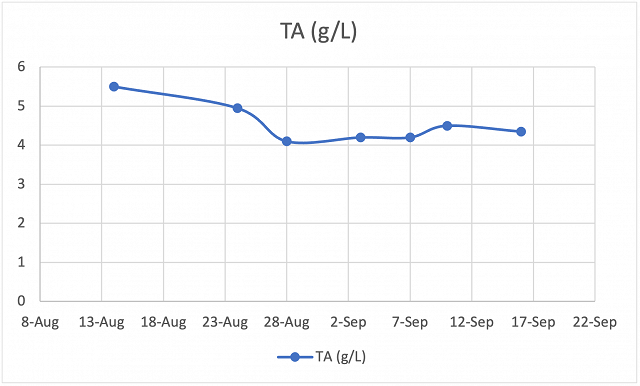
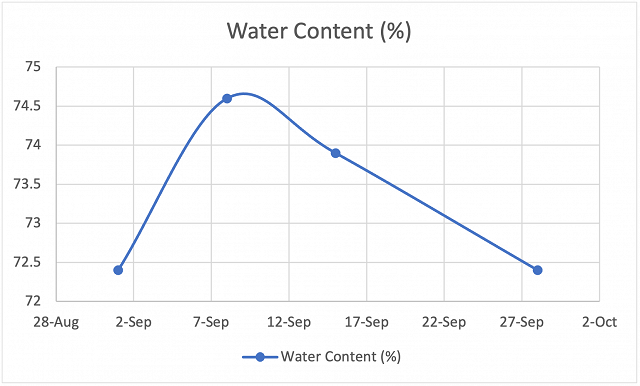
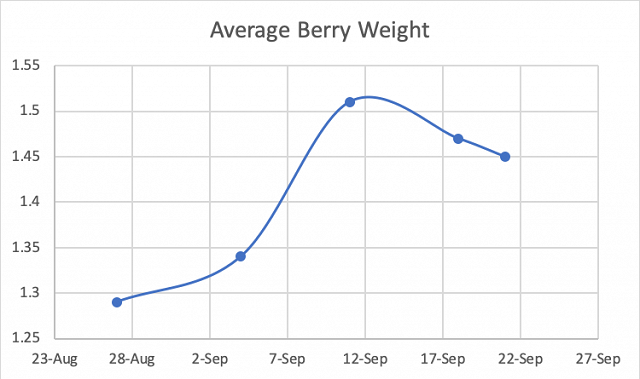
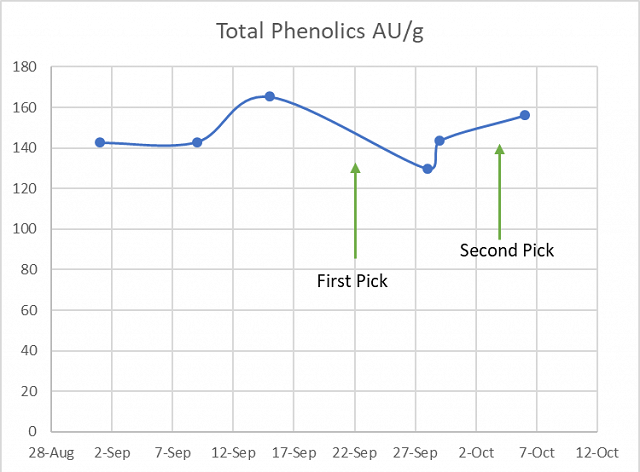
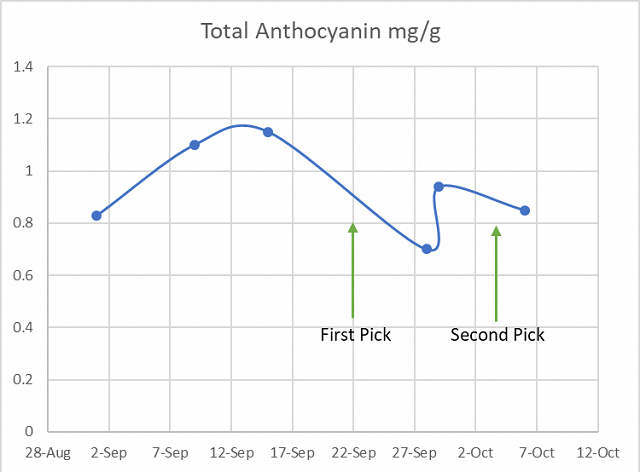
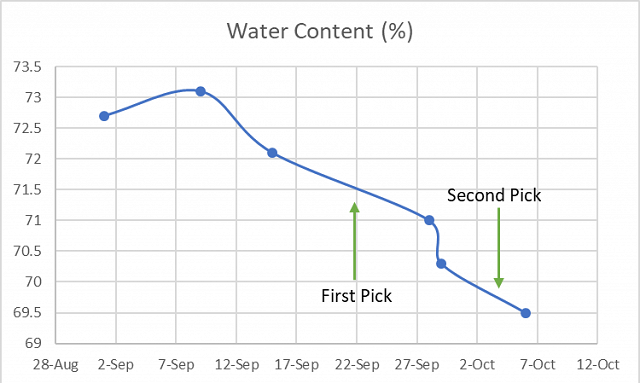
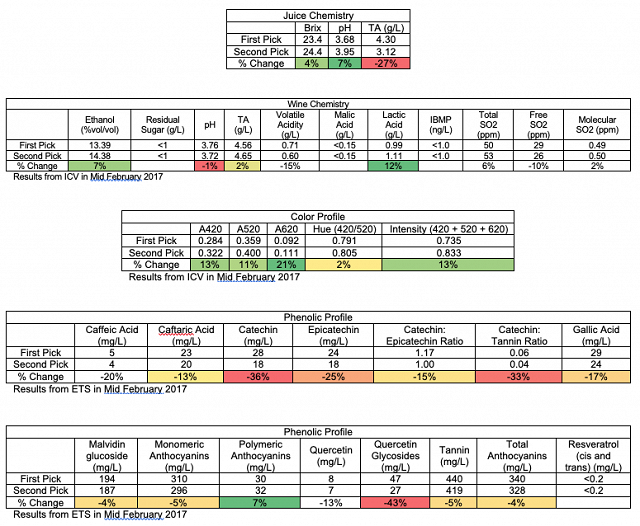
Grape ripening tended to follow classic ripening curves, exhibiting increasing Brix and a positive sigmoidal pH ripening curve. Average berry weight and water content peaked and then declined, due to dehydration. Phenolic content tended to peak and decline as well, and this occurred after the berry weight and water content began to decline.
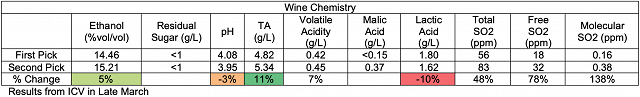
The first pick, based on phenolic ripeness, had lower alcohol. The differences in lactic acid may have been due to different malic acid additions between treatments. The first pick wine had slightly higher tannin and anthocyanin and much higher quercetin glycosides, but slightly lower color. However, this wine received Lafase HE Grand Cru, whereas the second pick wine may not have received this enzyme. This may have altered the results in this regard.
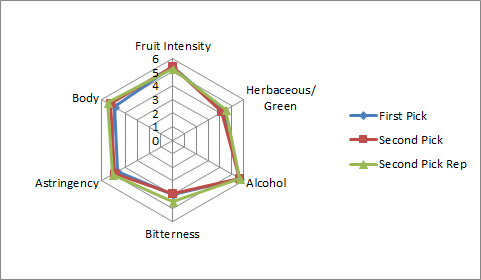
The same procedures for data analysis were used on the May 2 tasting. For the descriptive analysis in this tasting, one judge from both groups 1 and 2 were transferred to group 3 so that each group had 7 judges, for a total of 21 judges.For the triangle test on April 4, of 10 people who answered, 6 people chose the correct wine (60%), suggesting the wines are not significantly different at p<0.05. These wines are significantly different, however, at p<0.10. These wines were voted to have an average degree difference of 6 (out of 10) by those who correctly distinguished the wines, suggesting that the wines were moderately different. Of those who correctly identified the wines, 3 preferred the second pick, 1 preferred the first pick, and one had no preference. For the descriptive analysis, there were no strong trends for the descriptors used in this study. The first pick wines had a slight tendency to have higher Astringency and Bitterness.

For the triangle test on May 2, of 22 people who answered, 12 people chose the correct wine (55%), showing a statistically significant difference between wines (p<0.05). These wines were voted to have an average degree difference of 4 (out of 10), suggesting that the wines were moderately different. In general, people who answered correctly preferred the first pick to the second pick (10 winemakers preferred the first, 2 preferred the second). For the descriptive analysis, there were no strong trends for the descriptors used in this study. There was a slight trend for the second pick to have higher Bitterness, Body, and Astringency.
Overall, sensory analysis suggests that these wines were significantly different. There tended to be a preference for the earlier picked wine, but this preference was tasting-dependent. Descriptive analysis was inconsistent between tastings, and no conclusions can be drawn with regard to this. Due to this inconsistency, this study should be repeated multiple times to help gauge the impact of picking based on phenolic parameters on sensory qualities in wine. Additionally, the use of Lafase HE Grand Cru in one wine and perhaps not in the other could have further confounded these results, suggesting that this study should be repeated. However, the idea behind this technique of monitoring ripening may serve to be a useful guide to picking in Virginia, to harvest while phenolic levels are maximized before they begin to decrease.
Methods
A block of Cabernet Franc grapes was sampled beginning on September 1, 2017 and then every week from this point up to October 6. Samples were sent out to Enartis to measure phenolic parameters. Based on the change in phenolic concentration over time, harvest date recommendations were made by Enartis for September 22. The winemaker then also harvested based on when he would normally harvest the grapes (pushing for more ripening, also based on seed coloration), and harvested on October 4. Both lots of grapes were refrigerated overnight before being processed the next day. 30ppm sulfur dioxide was added at crush. The must was inoculated with 15g/hL ES488 after processing. The next day, 0.05g/L Lafase HE Grand Cru was added to the first pick fermentation (it does not appear that this was added to the second pick fermentation, but the notes were unclear in this regard). 0.30g/L malic acid and 1.5g/L tartaric acid was added to the second pick wine the day after inoculation. On October 18, the second pick wine received 0.2g/L malic acid and 1g/L tartaric acid. Wines were pressed after fermenting for 18 days for the first pick, and 19 days for the second pick, and racked the next day into barrel. On November 23 the first pick wine received 2.5g/L tartaric acid (this had been added to the second pick wine during fermentation), and each wine 66ppm sulfur dioxide, and 0.03 g/L Stab Micro. The second pick wine received an additional 1g/L tartaric acid.
These wines were tasted on April 4 and May 2. For the triangle test, descriptive analysis, and preference analysis for the April 4 tasting, anybody who did not answer the form were removed from consideration for both triangle, degree of difference, and preference. Additionally, anybody who answered the triangle test incorrectly were removed from consideration for degree of difference and preference. Additionally, any data points for preference which did not make sense (such as a person ranking a wine and its replicate at most and least preferred, when they correctly guessed the odd wine) were removed.
In order to balance the data set to perform statistical analysis for descriptive analysis on the April 4 tasting, any judge who had not fully completed the descriptive analysis ratings were removed. In order to then make the number of judges between groups equivalent, one judge from group 2 was was eliminated. This resulted in a final data set of 3 groups, each with 2 judges (considered as replications within groups, and groups were considered as assessors). Data was analyzed using Panel Check V1.4.2. Because this is not a truly statistical set-up, any results which are found to be statistically significant (p<0.05) will be denoted as a “strong trend” or a “strong tendency,” as opposed to general trends or tendencies. The statistical significance here will ignore any other significant effects or interactions which may confound the results (such as a statistically significant interaction of Judge x Wine confounding a significant result from Wine alone). The descriptors used in this study were Fruit Intensity, Herbaceous/Green, Alcohol, Bitterness, Astringency, and Body.
References
Adams, D.O. 2006. Phenolics and ripening in grape berries. Am. J. Enol. Vitic. 57:249-256.