Assessing Maturity: Beyond Brix and Acid (2019)
Emily Pelton
Veritas Vineyard and Winery
Summary
Several measures of fruit maturity are commonly used in Virginia vineyards, but none is a perfect indicator of ripeness. This study is one of four examining ripening kinetics of red grapes in Virginia during the 2019 growing season. For each location, grapes were sampled beginning 2 weeks after veraison, assessed for traditional measures of ripening as well as sugar per berry. Grapes were picked at two dates, September 15 and September 22, and resulting wines were assessed for measures of ripeness. Both wines had similar chemistry at the end of fermentation. The wine from the second pick had lower anthocyanins than the wine from the first pick. It is possible these wines differed in flavor and aroma compounds not assessed in this trial.
Introduction
“The timing of the grape harvest determines the maximum wine quality potential thereafter” (Zoecklein, 2001)1
Several measures of fruit maturity are commonly used in Virginia vineyards, but none is a perfect indicator of ripeness1–4. Sugar content, as measured by °Brix, is one of the most commonly used metrics. It is easy to measure, fairly uniform across the population of grapes, and can be an indicator of the primary metabolism of the plant2. Though sugar accumulation is not always correlated to the production of flavor and aroma compounds2, and that correlation is weaker in warm regions (like Virginia) than cooler regions1, the accumulation of sugar does provide a glimpse into the physiological state of the vine and its interaction with the environment5.
However, measuring Brix alone can be misleading due to the dynamics of sugar and water accumulation in the grape berry. This is even more difficult in Virginia, when periodic rain events during harvest make it difficult to know if a stall in Brix accumulation is due to dilution or the end of sugar production. In 2019, the Winemakers Research Exchange tracked Brix and berry weight in several vineyard trials and used this data to calculate sugar per berry.
Sugar is transported from the leaves to the grape dissolved in water, so as sugar loading occurs during ripening, the grape berry is also getting larger. At some point, the vine stops loading sugar into the grape, which also means less inflow of water. The grape berry also loses water through transpiration such that when sugar loading has ceased, any increase in Brix is no longer due to ripening, but rather dehydration. Physiological ripeness, then, can be defined as that point when the grape has reached its maximum sugar per berry5.
Sugar per berry can be calculated using °Brix and berry weight, measurements already taken at most wineries. The °Brix is equal to the total soluble solids in 100 g of juice, and sugar makes up 90-95% of those solids6, allowing an estimate of the concentration of sugar per berry as follows:
(°Bx /100) * grams/berry = sugar per berry (g/berry)
For a 100 berry sample that weighs 112 grams and measures 22°Bx,
(22°Bx/100) * 1.12 = 0.246 g sugar per berry
Practically, it is best to take a representative sample of at least 100 berries and weigh them on a scale that is accurate to at least 0.1 grams. Plotting the results of weekly samples over time (with more frequent sampling close to harvest) is needed to determine the change in sugar per berry during ripening.
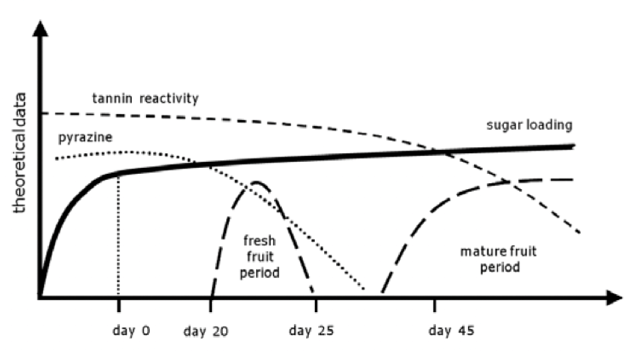
In red grapes, phenolic ripeness is often reached after physiological ripeness7, (Figure 2 from Deloire, 2011), but the timing of the end of sugar loading is still informative. It is thought that the amount of time from the end of sugar loading can be used to determine the evolution of aroma and flavor compounds as well as tannins. These changes mark the transformation of grapes from those that would result in fresh young red wines to those useful for more structured, age worthy red wines. With this in mind, sugar loading can be used in conjunction with other parameters to pick for a desired wine style. A balanced red wine is thought to come from grapes picked one to five weeks after the cessation of sugar loading, with the difference in duration largely due to the intended style of the wine. For fresh, young reds, the grapes would be picked 1-2 weeks later, to allow vegetal elements to decrease and desirable flavor metabolites to be formed. For more structured reds, a longer wait is needed to allow for the evolution of tannin reactivity7. Regardless of the desired wine style, measuring sugar per berry provides a starting point for the “maturation” clock.
Figure 1: From Deloire7, depicts the berry aromatic sequence in relationship to sugar loading and wine style. Once sugar loading has slowed down or stopped (“day 0”), the “physiological” clock begins, with flavors evolving as time progresses.
This study is one of four examining ripening kinetics of red grapes in Virginia during the 2019 growing season. For each location, grapes were sampled beginning 2 weeks after veraison, assessed for traditional measures of ripening as well as sugar per berry. In two of the four locations, the block was harvested twice, approximately one week apart, and wine was made separately from each harvest date. Wines were assessed for general chemistry, color, and phenolics. Sensory impressions of the winemakers are also included.
Methods
The Barn block of Petit Verdot at Castalia Vineyard was sampled weekly beginning 2 weeks after veraison (September 4), for a total of 5 sample points. Ripening kinetics (Brix/pH/TA) were monitored by the winery at each collection event. Sugar per berry was calculated according to Deloire (2011) and Zoecklein et al (1995). Given that °Bx = grams sugar/100ml H20 and 100 ml H20 = 100 g H20, then:
(°Brix * weight of 100 berry sample)/100 = grams of sugar per berry
Grapes were picked at two dates, September 15 and September 22. All other winemaking procedures were the same for both lots. Grapes were harvested and chilled overnight. The following day, grapes were destemmed into Tbins after sorting with addition of 0.25 g/L Tanin VR Supra, SO2 and 0.2 g/L Egide yeast (Laffort) for bioprotection. After warming, 0.16 ml/L Color Pro was added and bins were inoculated with 0.2 g/L ICV 254 yeast (Scottlabs) rehydrated in 0.02 g/L Fermoplus Energy Glu.
Fermentations were conducted in a temperature controlled refrigerated truck with an ambient temperature of 65°F. Fermentations were monitored daily for Brix and temperature. Actimax Natura organic nutrient (0.4 g/L) was added at 1/3 Brix depletion. Bins received 3 punch downs daily during active fermentation and 2 per day towards the end of the fermentation. After the completion of fermentation, wines from both harvest dates received 4 weeks of extended maceration with daily argon gassing.
After pressing, wine was allowed to settle, then was transferred to two second-use (2018) barrels per treatment and inoculated with 0.01 g/L Lactoenos 4560 Pre AC (Laffort) malic acid bacteria. After completion of malolactic fermentation, wine was treated with 40 ppm SO2 and racked. Wine was aged with periodic monitoring of SO2 and volatile acidity with additions of SO2 to a common target until sensory analysis.
Results
Though the Brix rose steadily, the amount of sugar per berry did not change after Sept 11 (Table 1, Figure 2). Any additional sugar concentration was likely due to berry dehydration (Table 1). According to Deloire7, this is the period where the grapes have reached physiological ripeness, but flavor and tannins continue to develop.
Though the Brix rose steadily, the amount of sugar per berry did not change after Sept 11 (Table 1, Figure 2). Any additional sugar concentration was likely due to berry dehydration (Table 1). According to Deloire7, this is the period where the grapes have reached physiological ripeness, but flavor and tannins continue to develop.
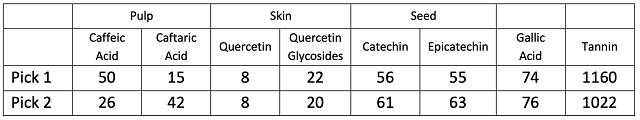
Fermentations for both lots progressed steadily with little difficulty (Figure 3), so any differences in chemistry are unlikely due to differences in fermentation kinetics. Wine chemistry and color were nearly identical for both picks (Table 2, Figure 3). There were slightly lower anthocyanins in the wine from the second pick (Table 4), though this did not produce a noticeable change in color (Figure 4). The remaining phenolics were mostly the same (Table 5). There appears to be a juxtaposition of caftaric and caffeic acids between the two picks (Table 5). Caftaric acid can be cleaved in must or wine to release caffeic acid (ETS labs). This cleavage can be accomplished by exogenous pectolytic enzymes (such as Color Pro) or by naturally occurring microorganisms (ETS labs). In this case the sum of the two acids is nearly the same, indicating the difference is due to production conditions rather than a shift due to ripening. Due to restrictions put in place during COVID-19, no sensory analysis was done on this wine.
In this case, additional hang time did not appear to improve phenolics in the wine. On the contrary, wine produced from the second pick had lower anthocyanins while not improving in extractable phenolics. It is possible that additional hang time increased flavor and aroma compounds not measured in this study.
Table 1: Ripening measurements for Castalia Petit Verdot (Barn)
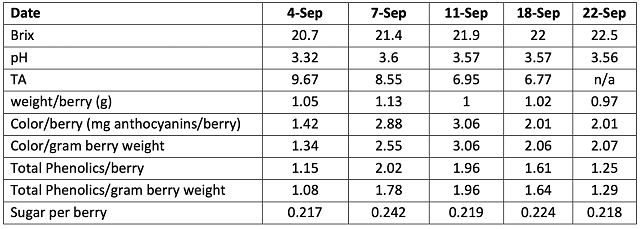
Table 2: Juice Chemistry for two picks of Petit Verdot
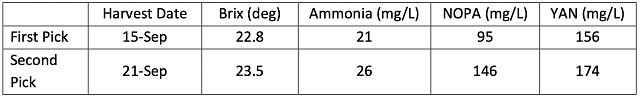
Figure 2: Brix and berry sugar loading during ripening
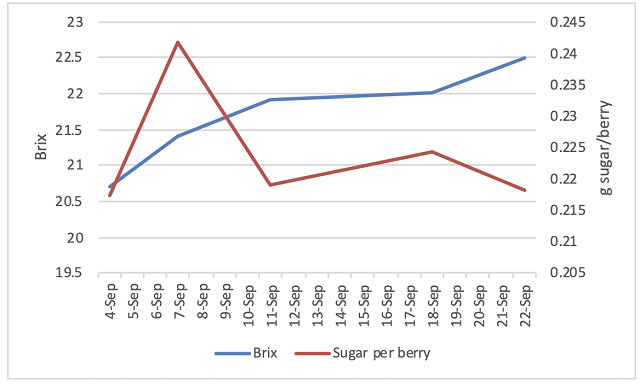
Figure 3: Fermentation Kinetics for two picks of Petit Verdot (in-house data)
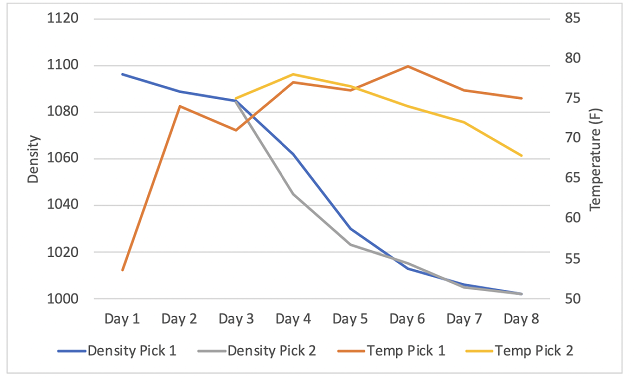
Table 3: Wine Chemistry for two picks of Petit Verdot (ICV labs Dec 2)
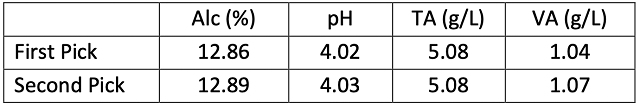
Table 4: Anthocyanins (mg/L) for two picks of Petit Verdot (ETS labs)
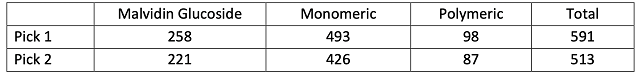
Figure 4: Wine color for two picks of Petit Verdot (ICV labs)
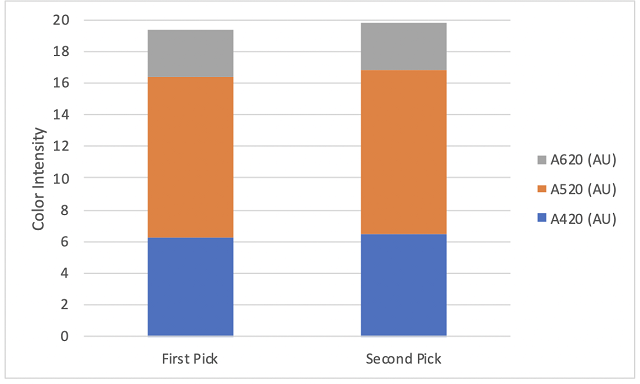
Table 5: Other phenolic measurements (mg/L) for two picks of Petit Verdot (ETS labs)
References
(1) Zoecklein, B. W. Grape Sampling and Maturity Evaluation for Growers https://www.apps.fst.vt.edu/extension/enology/VC/Jan-Feb01.html (accessed Oct 30, 2019).
(2) Bisson, L. In Search of Optimal Grape Maturity. Practical Winery and Vineyard Journal 2001.
(3) Plessis, C. S. D. Optimum Maturity and Quality Parameters in Grapes: A Review. South African Journal of Enology and Viticulture 1984, 5 (1), 34–42. https://doi.org/10.21548/5-1-2367.
(4) Conde, C.; Silva, P.; Fontes, N.; Dias, A.; Tavares, R.; Sousa, M.; Agasse, A.; Delrot, S.; Gerós, H. Biochemical Changes throughout Grape Berry Development and Fruit and Wine Quality. Food 2006, 1.
(5) Bernard, N. The Berry Sugar Loading : An Indicator of Grape Quality – Vintage Report Blog, 2017.
(6) Zoecklein, B.; Fugelsang, K. C.; Gump, B. H.; Nury, F. S. Wine Analysis and Production; Springer: New York, 1995.
(7) Deloire, P. A. The Concept of Berry Sugar Loading. Wineland Magazine, 2011.