Impact of pre-fermentation SO2 addition on microbial, chemical, and sensory characteristics of Viognier (2024)
Kirsty Harmon
Blenheim Vineyards
Summary
Sulfur dioxide is frequently added at crush to limit the oxidation of juice and the activity of spoilage microbes. However, it is difficult to quantify the amount of SO2 addition needed to achieve these goals in practice. In this experiment, juice from a single press load of Viognier was split into two tanks after pressing. One tank received a pre-fermentation addition of 30 ppm SO2 while the other received a 70 ppm addition. Juice that received 30 ppm SO2 was darker in color, however, there was no difference in cell density of spoilage organisms including Hanseniaspora, Pichia, and acetic acid bacteria between treatments. Wine made from 30 ppm juice contained lower total SO2 and total acetaldehyde than wine from the 70 ppm juice, but there was no difference in acetic acid concentration or color. These wines were not different in a triangle test, nor in scores for aromatic intensity, Viognier varietal character, volume, or finish.
Introduction
Sulfur dioxide is frequently added at grape processing to limit the oxidation of juice and the activity of spoilage microbes. However, it is difficult to quantify the amount of SO2 addition needed to achieve these goals for several reasons.
The antioxidant activity of SO2 is primarily due to its inhibition of enzymes that catalyze oxidations reactions. Enzymatic oxidation of juice is driven by polyphenol oxidase (PPO) enzymes present in grapes. The activity of these enzymes can vary up to an order of magnitude between grape cultivars, leading to variation in the amount of SO2 needed for inactivation1. Suspended solids in juice increase the presence of these enzymes, so higher juice turbidity increases the risk of oxidation1. The concentration of phenolic compounds (the substrate of browning reactions) and temperature also impact potential for juice oxidation2. One study showed that 25-75 mg/L of SO2 in clarified juice led to 75 and 90% reduction in PPO activity, respectively, with nearly all activity gone after a 50 mg/L addition. However, when laccase is present due to infection by Botrytis and other fungi, oxidation is much more difficult to control. Laccase enzyme is still 80% active in the presence of 150 mg/L free SO2!1
Many winemakers also rely on SO2 additions at crush for antimicrobial protection. As a multifaceted antiseptic, SO2 suppresses fermentation in sensitive organisms while allowing the more tolerant Saccharomyces cerevisiae to dominate. In this way, SO2 both inhibits spoilage microorganisms and selects for beneficial yeast2. However, the susceptibility of non-Saccharomyces yeast and bacteria to SO2 varies widely, depending on the organism’s growth phase and surrounding environmental conditions3. More than 93 different species of yeast and over 50 species of bacteria have been isolated from grape berries, many of which carry over into juice during pressing4. A commonly cited antimicrobial target of 0.875 – 1.25 mg/L molecular SO2 is thought to decrease the microbial community by several orders of magnitude, and may be sufficient to inhibit growth of most wild yeasts and bacteria3,5. However, when the initial microbial loads are high (as is often the case in Virginia), even a 99% reduction leaves substantial populations behind3.
Bacteria are more susceptible to SO2 than yeast. The addition of 30 ppm SO2 produces some inhibition6. A low pH environment is even more hostile, due to the double impact of low pH itself as well as the increase in the concentration of molecular SO22. Unlike yeast, bacteria are also inhibited by the fraction of SO2 bound to acetaldehyde. Though this inhibition is 5-10x weaker than molecular SO2, the bound fraction is much more abundant, leading to additional microbial control2.
Unfortunately, when it comes to spoilage, yeast have more cellular mechanisms to tolerate SO2. While the addition of 50-100 ppm SO2 to white must delays the growth of wild yeast, an estimated addition of 150 ppm would be needed to fully suppress growth!6 In red wines, even higher additions would be needed, meaning that the impact of additions of 20-60 ppm (as commonly seen) may be insignificant when it comes to spoilage yeast6. Also, if SO2 is added at sublethal amounts prior to fermentation, yeast adapt so that they are more tolerant to it later2.
If low (or no) SO2 is used at crush, the winemaker relies on the ability of Saccharomyces to outcompete spoilage organisms, rapidly consume oxygen that could be used for acetic acid and ethyl acetate production, and produce ethanol, that will limit spoilage organisms and their metabolites3. Though a low rate of SO2 addition may not fully inhibit non-Saccharomyces yeast, they may be helpful, in conjunction with other measures, to shift the microbial community away from spoilage toward a healthy fermentation. In a study of ambient fermentation in Canadian Pinot Gris, Morgan and Durall (2020) found additions of 20 and 40 mg/L SO2 decreased the prevalence of Hanseniaspora present in populations7.
Once fermentation starts, the amount of free SO2 is in constant flux depending on the activity of yeast. Upon addition, 40-70% of the SO2 quickly binds to sugars in the juice8, rendering it inactive against microbes or oxidative compounds. SO2 is later released as sugars are consumed during fermentation, however, is it quickly bound again by acetaldehyde.
Yeast normally produce a low level of acetaldehyde as a byproduct of fermentation. If SO2 is present, it binds to acetaldehyde to form acetaldehyde-SO2 complexes that promote additional biosynthesis of acetaldehyde by yeast8. This feedback loop serves as a detoxification method but may also lead to higher levels of acetaldehyde and bound SO2 in the wine. During bottle aging, slow oxidation reactions catalyzed by trace amounts of copper and iron lead to the combination of the bisulfite form of SO2 (H2SO3-) with H2O2 to form H2SO42. Removal of free SO2 shifts the equilibrium between free and bound forms to release bisulfite from acetaldehyde complexes8. Free acetaldehyde contributes to oxidized odor8 as well as amplifying the perception of volatile acidity9. In this way, the addition of SO2 at crush may actually increase the potential of wine to have oxidative aromas during bottle aging.
The purpose of this experiment was to explore the chemical, microbiological and sensory impact of “high” vs. “low” SO2 addition at crush. The data presented here are from a second year of experimentation (2024). In 2023, Chardonnay juice was split post pressing into two tanks. One tank received a pre-fermentation addition of 30 ppm SO2 while the other received a 70 ppm addition. The majority of the SO2 bound quickly, leaving <3 ppm free SO2 in the juice with the low addition rate and 7.4 ppm free SO2 in the juice with the higher rate. Juice that received the lower addition was darker in color, and contained 10-fold higher population of Hanseniaspora, Pichia, and acetic acid bacteria. Post fermentation, wine from the lower addition contained an average of 20 ppm lower total SO2 and 11 mg/L less total acetaldehyde. There were six barrels of wine in the 2023 Chardonnay experiment, three of one treatment and three of the other. Four of the six barrels were chosen for sensory analysis by a selected expert tasting panel of 15 winemakers. Tasters were asked to group the samples into two groups of two, then score the wines for specific descriptive characteristics. These wines were not different in a triangle test (only 6 of 15 winemakers correctly grouped the wines), however this was a small number of tasters. Anecdotally, at a tasting with winemaker, her staff, and WRE staff, everyone felt the wines had noticeable differences.
In 2024, the experiment was repeated using Viognier instead of Chardonnay. Viognier is generally more aromatic than Chardonnay, characterized by stone fruit and tropical aromas10, and is often characterized by high pH at harvest. The purpose of repeating the experiment is to determine:
- If sensory differences are clear with a larger tasting panel
- If sensory differences are apparent in an “aromatic” variety vs. “less aromatic” variety (ex: Viognier vs. Chardonnay)
Methods
There were two treatment levels:
- Addition of 30 ppm SO2 to settled juice prior to fermentation
- Addition of 70 ppm SO2 to settled juice prior to fermentation
All other operations and additions were done according to the standard protocol of the winery and were kept the same between treatments.
A single press load containing 2.42 tons of Viognier from Tiverton and Reed Vineyards was pressed with the addition of 30 ppm SO2 and 30 g/hL bentonite to the juice in the receiving tank. After mixing to homogenize, half of the juice was transferred to a second tank. That tank received an additional 40 ppm SO2 for a total of 70 ppm.
After all additions had been made and juice had settled, a sample was taken from each tank for analysis of juice chemistry (Imbibe Solutions) and microbiology (ETS). Appendix A includes the protocol for preparing the sample for shipping to ETS. Free SO2 of the juice was tested in house using the Sentia Wine Analyser. After settling, juice was transferred to neutral French oak barrels for fermentation. For the experiment, barrel 1517 contained juice with 30 ppm SO2 while barrel 1518 contained juice with 70 ppm SO2. Juice was inoculated with 20 g/hL EC1118 yeast in each barrel. Brix and temperature were monitored daily to assess fermentation kinetics. At the completion of fermentation, 75 ppm SO2 was added as Effergran granules. Wine chemistry including free SO2, total SO2, and acetaldehyde were measured post fermentation. In October, an additional 80 mg/L SO2 and 1 g/L tartaric acid were added to each barrel. Samples were taken for sensory analysis in late January.
Sensory analysis was completed by a panel of 30 wine producers. Wines were presented blind in randomly numbered glasses. Tasters were presented with three wines, two of one type and one of another, and asked to identify which wine was different (a triangle test). There were four tasting groups with the unique wine in the triangle test balanced between groups. Tasters were then asked to score each wine on a scale of 0 to 10 for color, aromatic intensity, Viognier varietal characteristic, and length of finish. Results for the triangle test were analyzed using a one-tailed Z test. Descriptive scores were analyzed using repeated measures ANOVA.
Results
Fruit was harvested with characteristic chemistry for Viognier, with relatively high Brix and high pH (Table 1). There was a noticeable difference in color between the two juice samples. Higher SO2 addition likely led to much lower browning in the juice. There was a noticeable increase in pH and decrease in TA in the juice that received 70 ppm treatment because this sample was refrigerated before testing while the 30 ppm treatment was tested upon delivery. This difference was unlikely due to SO2 treatment.
The microbial community was nearly the same between treatments (Figure 1). Though there was a relatively large population of Hanseniaspora, Pichia, and Acetobacter, adding 40 mg/L more SO2 did not decrease the population. This is a notably different result from the 2023 Chardonnay experiment, where there was an order of magnitude reduction in all three of these groups. In 2023, Chardonnay used for experimentation had a pH of 3.36 while the Viognier tested here has a pH closer to 3.8. At a pH of 3.36, 2.7% of the free SO2 is in the antimicrobial molecular form, while at a pH of 3.8, that proportion is only 1%. Juice and must with high pH will have very little antimicrobial protection from SO2.
Table 1: Juice chemistry (Imbibe Solutions, 8/30/24)
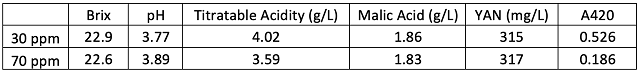
Figure 1: Juice microbiology taken after juice settling (ETS Scorpions Yeast and Bacteria, 9/2/24)
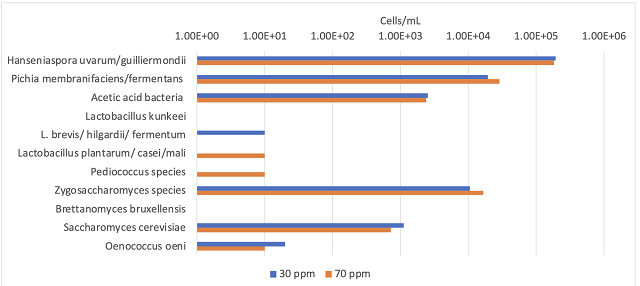
Figure 2: Fermentation kinetics for two treatments of Viognier (In-house data)
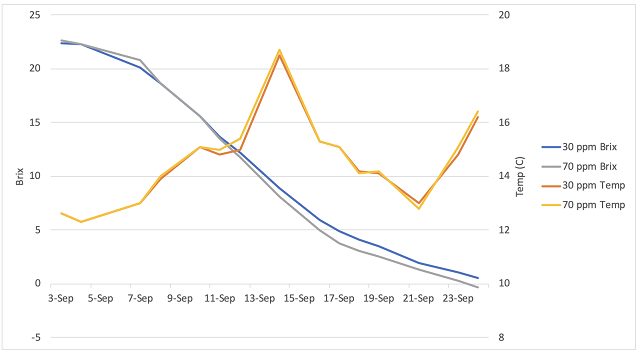
Juice from both treatments fermented with nearly identical kinetics and heat production (Figure 2). Both fermentations were complete (glucose <0.1 g/L, fructose <0.2 g/L, in-house data) by early October. There were no differences in general wine chemistry between treatments (Table 2). Both wines completed fermentation with no evidence of malolactic fermentation, and moderate acetic acid.
Table 2: Wine chemistry panel (ICV Labs, 10/31/24)
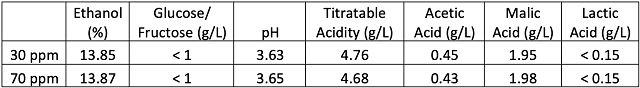
Figure 3: Free and bound SO2 (ppm) for two treatments of Viognier (ICV labs, 10/31/24). Total acetaldehyde (mg/L) (ICV labs) shown on endcaps. Free acetaldehyde was zero for both treatments.
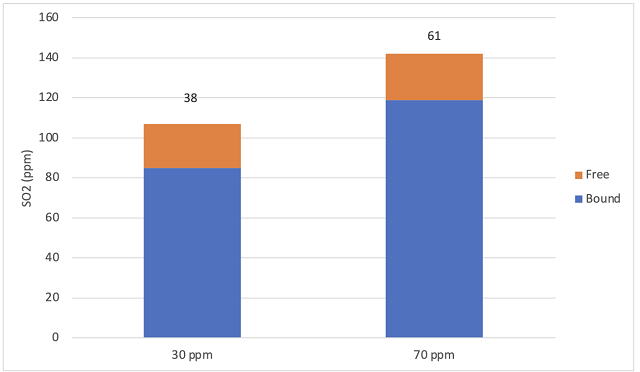
As expected, the wine with higher SO2 addition at crush finished fermentation and entered aging with higher total SO2, despite nearly identical free SO2 (22 and 23 ppm). Likewise, the wine that received 70 ppm to the juice before fermentation had a higher concentration of acetaldehyde post fermentation (Figure 3). Acetaldehdye is a primary binder of SO2, so it is not surprising that the free acetaldehyde value was zero. However, during aging, the equilibrium of free and bound SO2 can shift to release bound acetaldehyde. Acetaldehdye values below 100 mg/L are below the sensory threshold, so will not impart bruised apple character. At low concentrations acetaldehyde may even contribute to fruity aroma11.
Figure 4: Comparison of browning (A420 nm) in juice (Imbibe Solutions) and wine (ICV Labs)
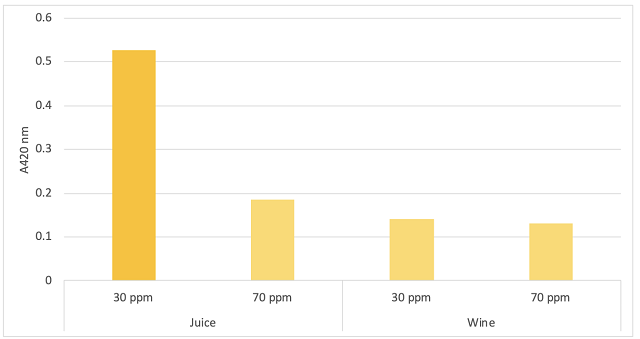
A higher dose of SO2 into juice led to notably lower color intensity. However, by the end of fermentation, there was no difference in pigmentation (Figure 4). Brown color is driven by the reversible oxidation of phenolic compounds. These compounds may have precipitated out of solution, leaving the wine more resistant to oxidation later, or simply been reduced back to a colorless form during fermentation. However, aroma compounds are also oxidizable to non-aromatic forms, which may be apparent in sensory analysis.
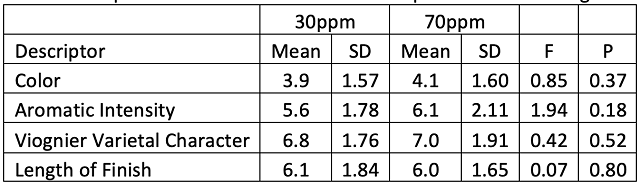
In a triangle test of wines that were treated with either 30 or 70ppm of SO2 at crush, 12 out of 30 respondents were able to distinguish which wine was different, indicating the wines were not significantly different (Z=0.58, p=0.28). There were no significant differences in scores for color, aromatic intensity, Viognier varietal characteristic, and length of finish (Table 3). In this case, any oxidation of aromatics was not extensive enough to impact aromatic intensity. Viognier varietal character is driven by esters rather than thiols, and as such, may be more resistant to oxidation.
Table 3: Repeated measures ANOVA of descriptive scores for Viognier
Appendix A: Instructions for sending juice samples to ETS for microbiological testing
Freezing kills some microbes, and although some will survive, they do not generally represent the entire population that was present before freezing. To assess the microbial community of juice populations, juice samples were centrifuged to collect cells at the bottom of the tube, then the juice was decanted into a second tube, separating cells from juice. Both tubes were sent as a pair to ETS overnight. At ETS, the juice was poured back into the original tube to reconstitute the initial concentration of cells.
References
(1) Boulton, R.; Singleton, V. L.; Bisson, L. F.; Kunkee, R. E. Principles and Practices in Winemaking; Chapman and Hall, Inc: New York, 1996.
(2) Ribereau-Gayon, P.; Dubourdieu, D.; Doneche, B.; Lonvaud, A. Handbook of Enology Volume 1: The Microbiology of Wine and Vinifications, 2nd ed.; John Wiley & Sons: West Sussex, England, 2006.
(3) Boulton, R. The General Relationship Between Potassium, Sodium, and pH in Grape Juice and Wine. American Journal of Enology and Viticulture 1980, 31 (2), 5.
(4) Liu, Y.; Rousseaux, S.; Tourdot-Maréchal, R.; Sadoudi, M.; Gougeon, R.; Schmitt-Kopplin, P.; Alexandre, H. Wine Microbiome: A Dynamic World of Microbial Interactions. Critical Reviews in Food Science and Nutrition 2017, 57 (4), 856–873.
(5) Jackowetz, N.; Li, E.; de Orduña, R. M. Sulphur Dioxide Content of Wines: The Role of Winemaking and Carbonyl Compounds. Appellation Cornell 2011, 3, 1–7.
(6) Margalit, Y. Concepts in Wine Chemistry, 3rd ed.; The Wine Appreciation Guild LTD: San Francisco, California, 2012.
(7) Morgan, F. Virginia Wine 2020 – Opportunities and headwinds (and a few opinions). Drink What You Like. https://drinkwhatyoulike.wordpress.com (accessed 2020-01-17).
(8) Jackson, R. S. Wine Science: Principles and Applications, 4 edition.; Academic Press: Amsterdam, 2014.
(9) Zoecklein, B.; Fugelsang, K. C.; Gump, B. H.; Nury, F. S. Wine Analysis and Production; Springer: New York, 1995.
(10)Viognier. Virginia Wine. https://www.virginiawine.org/varietals/viognier.
(11)Thomas, T. Acetaldehyde. Waterhouse Lab, UC Davis. https://waterhouse.ucdavis.edu/whats-in-wine/acetaldehyde