Impact of pre-fermentation SO2 addition on microbial, chemical, and sensory characteristics of Chardonnay (2023)
Kirsty Harmon
Blenheim Vineyards
Summary
Sulfur dioxide is frequently added at crush to limit the oxidation of juice and the activity of spoilage microbes. However, it is difficult to quantify the amount of SO2 addition needed to achieve these goals in practice. In this experiment, juice from a single press load of Chardonnay was split into two tanks after pressing. One tank received a pre-fermentation addition of 30 ppm SO2 while the other received a 70 ppm addition. The majority of the SO2 bound quickly, leaving <3 ppm free SO2 in the juice with the low addition rate and 7.4 ppm free SO2 in the juice with the high rate. Juice that received 30 ppm SO2 was darker in color, and contained 10-fold higher population of Hanseniaspora, Pichia, and acetic acid bacteria than juice receiving 70 ppm. Wine made from 30 ppm juice contained an average of 20 ppm lower total SO2 and 11 mg/L less total acetaldehyde than wine from the 70 ppm juice, with no difference in acetic acid concentration or color. These wines were not different in a triangle test, nor in scores for aromatic intensity, volume or finish.
Introduction
The winemaking plan for Chardonnay at Blenheim is designed to allow Saccharomyces yeast to complete a healthy fermentation in a reasonable amount of time (10 days to 2 weeks) without off aromas. During her training, Kirsty was taught to add 30-100 ppm of SO2 at fruit processing depending on the quality of the fruit. In recent years, her addition rates have tended toward the higher end of the range, averaging 70-100 ppm. For Kirsty, the purpose of pre-fermentation SO2 addition is to decrease microbial activity by wild yeast species and bacteria, essentially “cleaning up” the juice to allow a clear path for Saccharomyces activity.
In 2022, one of the white wines at Blenheim developed aldehydic character during aging, despite maintaining adequate free SO₂. Saccharomyces detoxifies SO₂ during fermentation by producing acetaldehyde, with higher SO₂ levels leading to greater aldehyde formation1. These aldehydes can later be released from bound forms during aging, contributing to off-odors even when free SO₂ is adequate1. This suggests that controlling aldehyde production during fermentation may be critical to reducing aldehydic character in finished wines.
In addition to aldehyde production, there are other potential problems with high pre-fermentation SO2 addition. SO2 binds to biotin, which can be a limiting micronutrient for yeast2. When yeast are deficient in biotin, they produce higher levels of acetaldehyde3. The addition of SO2 at crush presumably leads to higher bound and total SO2 values in the wine. Though the bound form of SO2 does not have antimicrobial activity against Brettanomyces or acetic acid bacteria, it does inhibit malolactic fermentation1,2. High levels of total SO2 are also sometimes associated with muted aromatics and/or harsh finish on the wine, though these observations are often also associated with high free (and molecular) SO2 values3.
The purpose of this experiment was to explore the impact of SO2 addition rate on the pre-fermentation microbial community, acetaldehyde production during fermentation, and overall sensory characteristics of the finished wine.
Methods
There were two treatment levels in this experiment:
- Addition of 30 ppm SO2 to settled juice prior to fermentation
- Addition of 70 ppm SO2 to settled juice prior to fermentation
All other operations and additions were done according to the standard protocol of the winery and were kept the same between treatments.
For the experiment, a single lot of fruit was whole cluster pressed with the addition of 30 ppm SO2 to the juice in the receiving tank. Then, half of the juice was transferred to a second tank. That tank received an additional 40 ppm SO2 for a total of 70 ppm. Bentonite (30 mg/L) was added to each tank to assist with settling.
After all additions had been made and juice had settled, a sample was taken from each tank for analysis of juice chemistry (Imbibe Solutions) and microbiology (ETS). Free SO2 of the juice was tested in house using the Sentia Wine Analyser. After settling, juice was transferred to neutral French oak barrels for fermentation. There were 3 barrels for each treatment. Inoculation of 20 g/hL EC1118 yeast was done in barrel. Brix and temperature were monitored daily to assess fermentation kinetics. At the completion of fermentation (the end of September), 60 ppm SO2 was added to all barrels. Two other additions of SO2 were made (to all barrels) during aging: 9 ppm SO2 in October plus 9 ppm in December.
Sensory analysis was completed by a panel of 15 wine producers using shipped samples. Each wine producer received four wines in identical bottles, filled on the same day, each coded with random numbers. Two of the bottles contained 30 ppm wine while two other bottles contained 70 ppm wine. Participants were asked to group the samples into 2 groups of 2 based on similarity. There were four tasting groups per flight with the wines presented in different order for each group. Participants were then asked to score each wine on a scale of 0 to 10 for aromatic intensity, volume, and finish. They were also given open ended questions to describe the wines. Results for the triangle test were analyzed using a one-tailed Z test. Descriptive scores were analyzed using repeated measures ANOVA.
Results
There was no difference in Chardonnay juice chemistry after the tanks were split and SO2 had been added (Table 1). In-house analysis showed that the juice receiving 30 ppm addition of SO2 had no detectable free SO2 (<3 ppm) prior to inoculation while the juice receiving 70 ppm addition had 7.4 ppm free SO2. The juice that was treated with 70 ppm SO2 was visibly lighter in color than the juice treated with 30 ppm SO2 (Figure 1).
Table 1: Post treatment juice chemistry (Imbibe Solutions, 9/4/23)
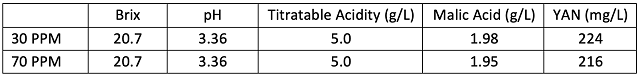
Figure 1: Post settling juice samples. The bottle on the left of each pair contains the juice that received a 30 ppm SO2 addition. The bottle on the right of each pair contains juice that received a 70 ppm addition.
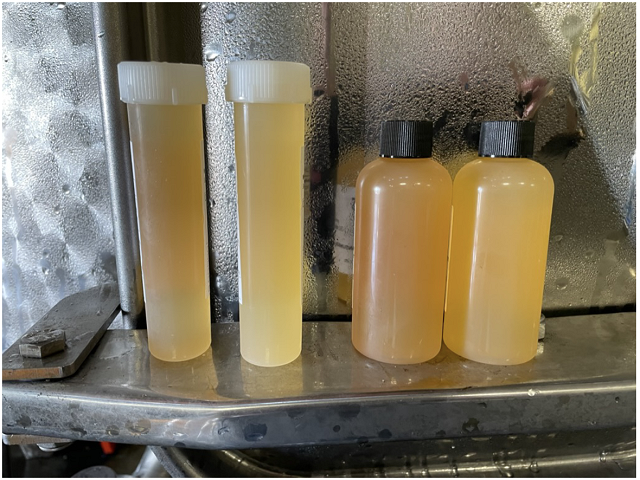
Figure 2: Post-settling microbial community for two treatments of Chardonnay (ETS Labs, 9/6/23)
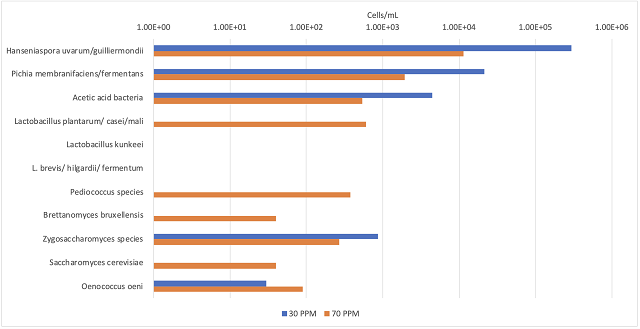
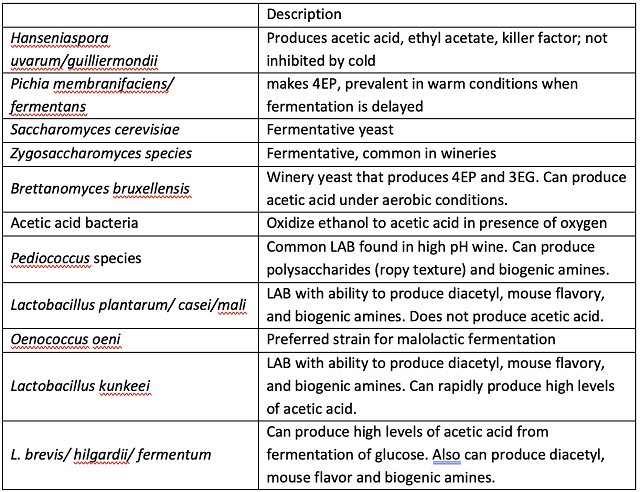
The juice that received 70 ppm SO2 had 10 times fewer cells/mL of the common spoilage organisms Hanseniaspora, Pichia, and acetic acid bacteria (Figure 2). These organisms can be responsible for producing acetic acid, ethyl acetate and even 4EP (Table 2). Saccharomyces and Oenococcus were rare in this analysis.
Table 2: Explanation of microbial community surveyed (ETS Labs)
Post-inoculation, fermentation proceeded in a robust and consistent manner (Figure 3). There was no consistent difference in Brix depletion or temperature based on initial SO2 addition. Wine finished the fermentation with glucose/fructose values <0.2 g/L (in-house data).
Figure 3: Fermentation kinetics for six barrels of Chardonnay. Barrels that received 30 ppm SO2 at crush are shown in blue (Brix) and orange/red (Temp) while barrels that received 70 ppm SO2 are shown in green (Brix) and yellow (Temp).
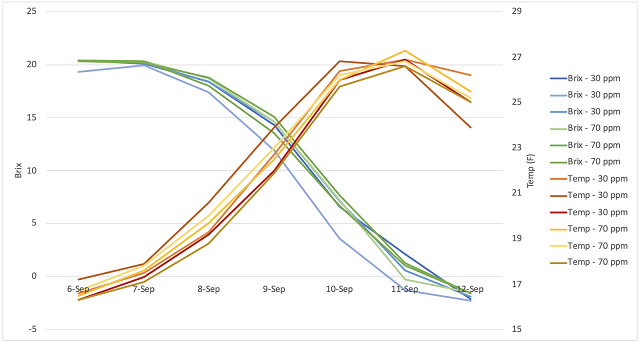
Table 3: Post fermentation acetic acid and acetaldehyde found in three barrels each of two treatments of Chardonnay (ICV Labs, 9/25/23)
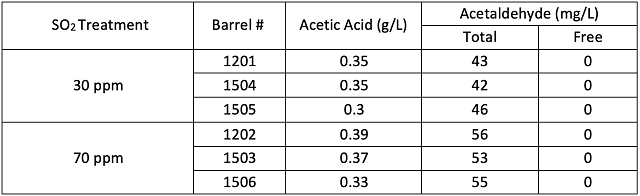
Despite differences in the initial microbial community, wine acetic acid concentrations were not different between treatments (Table 3). The treatment that received higher SO2 at crush had higher total acetaldehyde, however, the difference was once again small. The sensory limit of detection for free acetaldehyde is 100 mg/L, while bound acetaldehyde has no sensory impact, so these differences are unlikely to impact the sensory characteristics of the wines.
Figure 4: Total sulfur dioxide (mg/L) of Chardonnay wines treated with 30 ppm and 70 ppm SO2 at crush (ICV labs, 9/29/23).
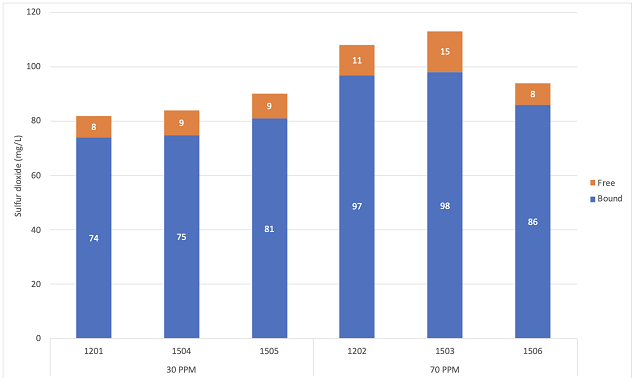
Wine made from juice that received the 70 ppm SO2 addition at crush completed fermentation with higher total SO2 than the wine that received 30 ppm SO2. (Figure 4). However, though the “high” addition was 40 mg/L higher than the “low” addition, the average total SO2 only increased by 20 mg/L. Not all added SO2 results in bound sulfite, some is lost by oxidation reactions to form sulfuric acid and other sulfonates or precipitation with lees3,4. All color measurements were below the detection threshold (<0.1)(data not shown).
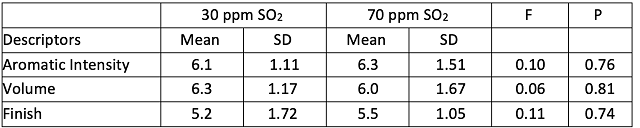
In a sensory analysis of wines treated with either 30ppm SO2 or 70ppm SO2, only 6 out of 15 respondents were able to distinguish which wines should be grouped together, indicating the wines were not significantly different (Z=0.27, p=0.39). There were also no significant differences in scores for aromatic intensity, volume, or finish (Table 4).
Table 4: Repeated measures ANOVA off descriptives scores from blind sensory testing.
References
(1) Boulton, R.; Singleton, V. L.; Bisson, L. F.; Kunkee, R. E. Principles and Practices in Winemaking; Chapman and Hall, Inc: New York, 1996.
(2) Jackson, R. S. Wine Science: Principles and Applications, 4 edition.; Academic Press: Amsterdam, 2014.
(3) Ribereau-Gayon, P.; Dubourdieu, D.; Doneche, B.; Lonvaud, A. Handbook of Enology Volume 1: The Microbiology of Wine and Vinifications, 2nd ed.; John Wiley & Sons: West Sussex, England, 2006.
(4) Margalit, Y. Concepts in Wine Chemistry, 3rd ed.; The Wine Appreciation Guild LTD: San Francisco, California, 2012.
Appendix A: Instructions for sending juice samples to ETS for microbiological testing
Freezing kills some microbes, and although some will survive, they do not generally represent the entire population that was present before freezing. To assess the microbial community of juice populations, juice samples were centrifuged to collect cells at the bottom of the tube, then the juice was decanted into a second tube, separating cells from juice. Both tubes were sent as a pair to ETS overnight. At ETS, the juice was poured back into the original tube to reconstitute the initial concentration of cells.
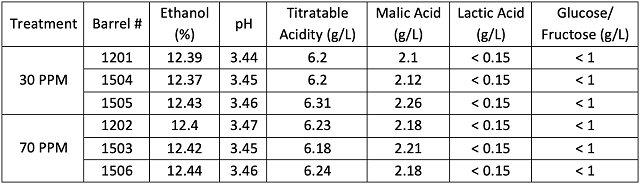
Appendix B: Non-SO2 related wine chemistry of Chardonnay treated with two levels of SO2 (ICV Labs 9/29/23)