Summary
Bentonite products differ in origin, chemistry, and processing in ways that lead to differences in binding and packing. The purpose of this experiment was to determine the range of differences among bentonite products. Each bentonite was tested for its ability to stabilize the same barrel-fermented Viognier wine in two rounds of benchtop heat tests. Binding curves were used to calculate the expected rate of bentonite needed to achieve stability in this wine, then tested in a third bench trial. Large differences were seen in the bentonite rate needed for stability, with KWK needing the least (30 g/hL) and Pluxcompact needing the most (>96 g/hL). There was also notable variation in turbidity between tests, indicating a need for check tests if protein stability must be reached. Another major concern with bentonite use is the wine volume lost during racking off bentonite lees. To test the compaction efficiency of each product, bench tests were performed at the effective dose. Once again, large differences were seen in bentonite compaction with Pluxcompact treatment resulting in the least amount of loss (<0.4% of volume) and Plubenton N, Bentogran and Plusgran all showing loss rates at or above 10%. In a wine that will sell for $20 per bottle, this amounts to a loss of several hundreds of dollars of lost revenue per barrel. The most important outcome of protein stabilization is the sensory impact. Many winemakers shy away from protein stabilizing their wine because they are concerned about flavor stripping. Mastervin Compact, Pluxcompact, Bentogran, and KWK were chosen to be tested for sensory effects. Each was added at its effective dose to a carboy of Viognier and allowed to settle for one week. Wine was racked off and evaluated during two separate sensory sessions. These wines were also chemically analyzed for esters. There were no significant differences in the perception of aromatic intensity among the wines tested. Treated wines were not distinguishable from control wine that had not been fined. Esters were also very similar for all of the wines tested, including control.
Introduction
Protein instability is a widespread issue in Virginia white and Rosé wines. Bentonite is commonly used to improve protein stability, and nearly every manufacturer has one or several bentonite products for sale. When reading product descriptions, it can be difficult for the winemaker to know which product is right for his/her application, and if more expensive products are worth the added cost. Bentonite products differ in origin, chemistry, and processing in ways that lead to differences in binding and packing. The following studies were designed to explore the range of products for the ability to remove unstable protein, compaction rate/volume loss of wine, overall price per volume treated, and sensory effects.
Bentonite is a form of Montmorillonite clay mined from sites all over the world. In the US, bentonite is sourced from mines in Wyoming1. As a natural product, the base clay for any bentonite product is variable depending on the site from which it was mined. After it is removed from the ground, bentonite is further processed at the manufacturer (“activated” and “granulated”), which can include the replacement of cations to improve binding efficiency and addition of silica to improve compaction rate. Bentonite can also be processed to improve hydration rates.
There are two main categories of bentonite products: sodium (Na) and calcium (Ca). Chemically this describes the predominant cation bound to sheets of tetrahedral silicon oxide and octahedral aluminum hydroxide2. Practically, the difference in these types affects the swelling capacity, protein binding and lees compaction. When sodium bentonites are hydrated in water, the clay particles separate so they are on average 100 Angstroms apart. (An Angstrom is a unit of measure that is 1x10⁻¹⁰ meters, or, 10,000,000 times less than an milimeter.) Calcium bentonites do not swell as much, and remain on average 10 Angstroms apart2. This difference in swelling has several consequences. Due to better swelling, sodium bentonites have more exposed surface area for protein binding, thus they tend to be more efficient (less bentonite is needed to achieve stability). However, this same swelling capacity means that sodium bentonites have fluffier lees, with an average of 5-10% of the volume lost during racking1. Calcium bentonites form a denser lees layer, leading to less loss. Some sodium bentonites are processed with silica gel to improve compaction rates. Some calcium bentonites are “activated” by exposure to a wet slurry of sodium carbonate that causes the exchange of some sodium and calcium ions2. If using a sodium bentonite, Zoecklein (1995) suggests combining bentonite fining with cold stabilization, as potassium bitartrate crystals will also help compact bentonite lees.
In addition to differences in the major cations, bentonites can also differ in a number of other characteristics that affect binding efficiency. A study of the chemical and physical structure of four sodium-based bentonites3 found notable differences in iron, magnesium, calcium, and sodium ions among the bentonites, as well as differences in their charge density per surface area, swelling potential, and pH3. Small differences in chemical substitution or mineral content can cause large differences in protein binding and bentonite compaction rate. These differences also affect how the binding curves change with environmental changes. For example, some bentonites are more affected by changes in pH than others3.
This can be illustrated by a study done by Blateyron et al (2007) who tested 24 wines fined with 11 different bentonites. They found significant differences in binding curves of the same bentonite used with different wines as well as between different bentonites used on the same wine, indicating the complexity in the interaction between one and the other. This study was searching for a mathematical model to predict how much bentonite was needed to stabilize wine based on the starting instability and the bentonite used. Due to the many variables, the best estimates were still only accurate within 15 g/hL 50% of the time. Using additional information, a model could be built from one vintage that was 84% accurate, however, when applied to previous vintages it was highly inaccurate, correctly predicting bentonite rate only 33% of the time4, indicating significant vintage variation, and invalidating the model.
Several factors affect the binding of wine proteins to bentonite including the presence of other cations in the wine, ethanol content of the wine, and pH2.
- As a positively charged cation, potassium will bind to bentonite, and has been show to decrease in wines treated with bentonite3. This means bentonite binding sites can be partially saturated in high potassium wines, making bentonite less effective at protein fining. It also means bentonite fining can help with tartrate stabilization of the wine3.
- Ethanol content of the wine will change the polarity of the solution, which will affect the overall charge on the bentonite particles.
- Changes in pH have a complex effect. At lower pH, there are more hydrogen ions available to coat the negative charges on the bentonite, causing the house of cards structure to partially fall apart, leading to less exposed surface area for protein binding. On the other hand, lower pH also shifts the net charge of proteins to a more positive state, making it more likely they will bind to bentonite sheets if they come into contact3.
The impact of each of these factors also depends on the chemical and physical structure of the bentonite being used. For all of these reasons, it is important to perform any bentonite bench trials on the final blend of the wine, with all other fining steps and additions completed. Bench trials prior to blending should incorporate each of the possible changes that will be made prior to bentonite fining.
Given all of the differences between products, how is a winemaker to choose? Most product descriptions for bentonite include a listing of the predominant cation (sodium or calcium) as well as some description of the manufacturing process and the benefits of the given product. However, as described above, the exact interaction of a given bentonite with a given wine, and its effects on the overall attributes of the wine are hard to predict. The first concern for winemakers is the effect on sensory attributes. In their study of 24 wines and 11 bentonites, Blateyron et al (2007) tested the sensory impacts of each bentonite at its effective rate (the rate that led to a change in NTU less than 2.0). Of these pairs, only 4 wine/bentonite pairs could be distinguished from the control (unfined wine) in an A-not-A test. (In an A-no-A test, participants are given a standard and an unknown and asked to identify if the unknown was the same as the standard or different)4. In a study of protein fining in Sauvignon Blanc, Vela et al (2017) found no significant differences in ethyl esters or acetates, and no impact on aroma in sensory analysis, despite high addition rates (100 g/hL) needed to achieve protein stability5. A review of the literature shows mixed results of sensory effects of bentonite fining at all, and no real guidance on type or specific products that may have less sensory impact.
Another major concern with bentonite use is volume loss. Waters et al (2005) cites an estimate that the cost of bentonite fining of wine per year is on the order of $300-500 million6 while Robinson et al (2012) cites a figure of $1 billion7. These losses are largely due to wine lost during racking off bentonite lees. If 5-10% volume is lost at this step1, these costs add up quickly.
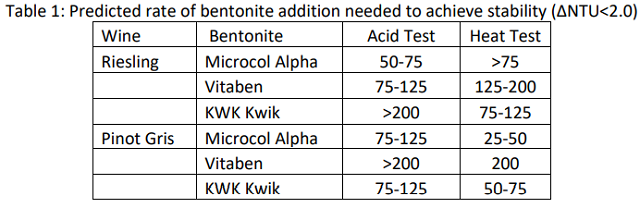
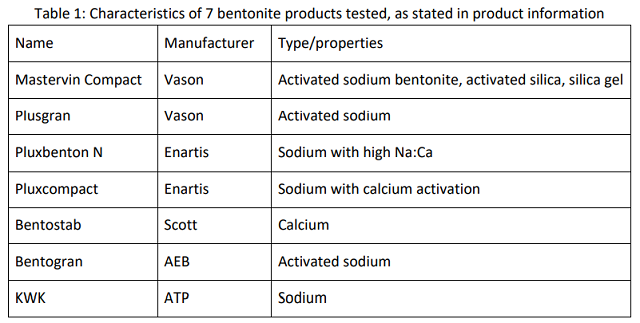
The purpose of this study was to explore the range of effectiveness of 7 bentonite products from 5 different manufacturers readily available on the US market (Table 1). The list included both sodium and calcium bentonites of various preparations. Each bentonite was tested for its ability to stabilize the same Viognier wine. After stability was determined, compaction rate and product loss were estimated at the effective dose. Each bentonite was also tested on a second wine (Sauvignon Blanc) at a single rate to rank the bentonites for efficacy. An estimate cost of loss for each product was calculated based on a value of $20 per bottle. Four of the products were chosen for larger scale fining trials leading to sensory and ester analysis of the wine.
Protein Stability Bench Trials
Procedure
To determine the efficacy of seven bentonite products, barrel fermented Viognier was tested for protein stability using the standard heat test of the winery. Wine was treated with bentonite stock solution at sequential rates of addition and allowed to settle overnight. The next day, the wine was decanted off bentonite and filtered through glass wool to remove particulates. The initial NTU was measured, the wine was heated to 80°C for 30 minutes, then allowed to cool on the benchtop. The final NTU was measured and a change in turbidity was calculated. A ∆ NTU < 2 was considered stable.
An initial heat test was performed on untreated Viognier. The following formula was used to estimate the amount of bentonite needed to achieve stability (from the dissertation of Laurent Duleau, published in Brugirard 1997):
Bentonite (g/hL) = NTU x 1.5 +5
In the initial trial, ∆ NTU = 16, leading to an estimated dose of 30 g/hL bentonite. Bench tests were conducted using 20 g/hL, 30 g/hL, 40 g/hL bentonite addition for each product. Stock solutions of each bentonite were prepared as either 1:10 or 1:20 dilutions according to manufacturer’s instructions one week before trials began.
The initial set of trials failed to achieve stability for most of the bentonite products. Possible sources of error were examined and the following changes were made:
- Stock solution preparation: New stock solutions were prepared with the same hydration time that would occur in the cellar. Appendix A contains rehydration instructions for each product, which were followed for rehydration of stock solutions as well.
- Volume of the stock solutions was increased from 20 mL in the first trial to 250 mL in the second trial to limit the effects of measuring errors.
- Each stock was made at 1:20 dilution to limit the effects of pipetting error.
A second round of testing was performed using new stock solutions at 30, 50, and 70 g/hL. After each round of testing, results were graphed and the equation for the best fit line was used to estimate the concentration of bentonite needed to achieve stability. This estimate was checked in a final round of testing.
Results
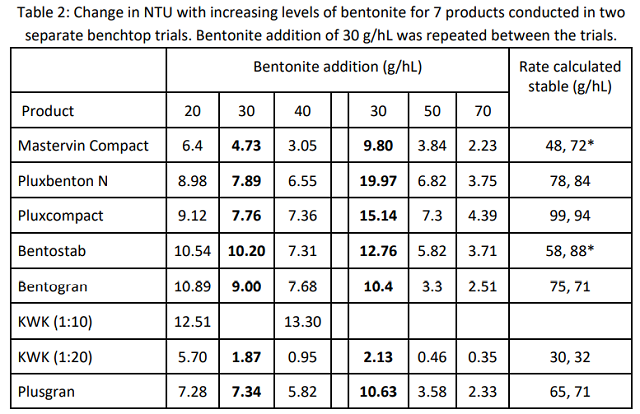
Results from the first and second round of bentonite bench trials can be found in Table 2. The untreated sample had a change in NTU of 16 in the first trial and 19 in second trial. Though these tests differed in range, both included values from addition of 30 g/hL. There is a large difference in turbidity at this level between trials. For each bentonite, turbidity was higher at 30 g/hL in the second trial. This may be due to the longer swelling time afforded the stock solutions in the first trial. Or, these differences may reflect an error rate inherent to the test itself. In a study of small scale fining trials, Weiss et al (2001) found consistency in results with a single operator on unfined wines, but considerable differences within and between operators on bentonite-fined wines8. They recommend running replicate tests. This is often impractical in the production winery. Therefore, for those who must achieve stability for long distance transport or for addition of CMC, it is recommended to check protein stability after bentonite addition to confirm that stability has been reached.
Though the results from the first trial may reflect the theoretical binding capacity of the bentonite product when fully swelled, the stock solutions in the second trial were prepared closer to that which would be encountered in the cellar, and therefore represent a closer approximation of the actual binding kinetics of each product.
KWK was initially mixed at 1:10 dilution but the viscosity of the stock solution made pipetting difficult and gave inconsistent results. The stock solution was diluted to 1:20, which yielded more consistent results. Weiss et al (2001) showed that pipetting error with 1:20 dilutions of bentonite was very small8. Results from the 1:10 dilution are reported to show that, though the package instructions give a range of 1:10- 1:20 dilution for preparation, it is recommended to use 1:20 for KWK given this viscosity.
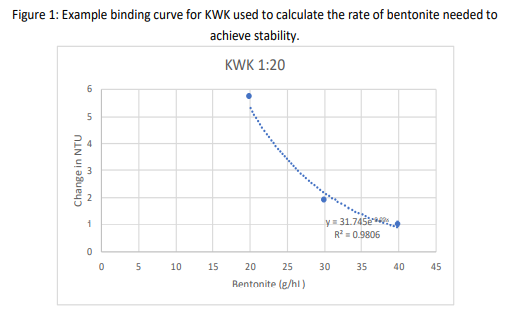
For each of the two trials, results were plotted in Microsoft Excel, which was then used to calculate an equation for the line describing bentonite binding kinetics. This equation was used to calculate the bentonite addition at which the wine would be stable. Binding curves for bentonite are known to be exponential, meaning more and more bentonite is needed to achieve the same change in NTU at higher levels of stability4,9. Results from the first trial tended to be in the linear (left hand) portion of the curve while those from the second trial revealed the exponential (right hand) portion of the binding curve. The binding curve for KWK is shown (Figure 1) as an example of this analysis.
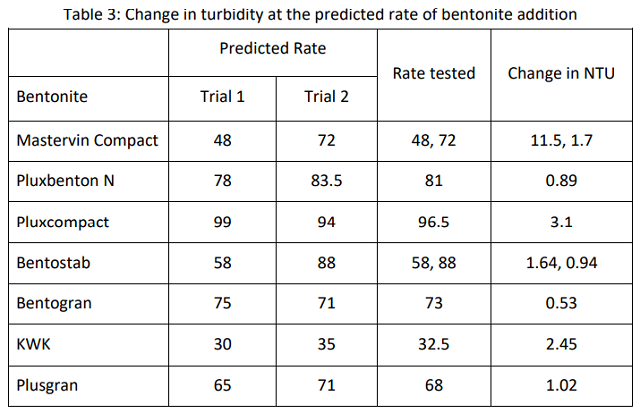
For all but two of the bentonites, the value calculated to achieve stability for the first trial was within 10% of that which was calculated for the second trial, so an average of these two values was used to determine the bentonite rate to be used for the compaction test. In conjunction with the compaction trial, stability of the wine was checked at the predicted rate of addition. Results from this check test are shown in Table 3.
The levels of bentonite predicted to achieve stability using Mastervin Compact and Bentostab were both beyond a 10% difference. Samples of both of the predicted levels of each bentonite were tested for compaction, and the stability of each was measured, allowing for clarification of which rate is most appropriate for each. Mastervin compact achieved stability at 72 g/hL while Bentostab achieved stability at 58 g/hL.
Five of the seven bentonites achieved stability with the level of bentonite predicted by calculation from previous curves. In the two cases without definitive fining rates, the turbidity value of the check test was added to the existing data to estimate the rate to be used for the carboy trials.
Neither KWK nor Pluxcompact achieved stability in the check test. The predicted rate of bentonite needed for stability using Pluxcompact is very high. Since the binding curves for bentonite are exponential, the error rate of prediction increases with increased dose rate. Essentially, the change in dose rate needed flattens out at high dose rates, so a small change in turdity requires a large change in bentonite. In addition, variation in accuracy of protein stability testing is higher with higher addition rates of bentonite8.
The estimated rate of KWK was likely in error due to swelling time of the stock solution or mixing regime. Though the other bentonites are formulated for quick swelling, KWK requires longer swelling time.
Bench Trials for compaction and volume loss
Methods
Compaction efficiency of each product was tested by adding the effective dose of bentonite to barrel-fermented Viognier in a 22 mL in clear conical borosilicate tubes with marked volumes. Bentonite was allowed to settle for one day after which time the compaction rate was determined for each product. Tubes were left on the benchtop and allowed to settle for one week, after which compaction rates were checked again. Compaction rate was used to calculate % loss due to lees.
Results
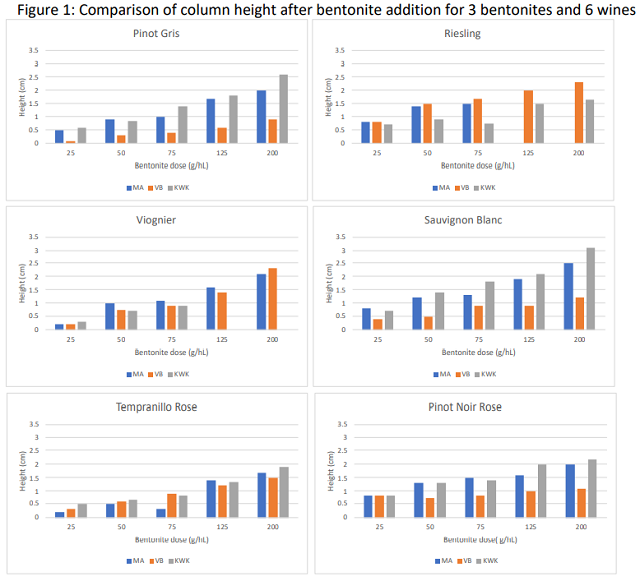
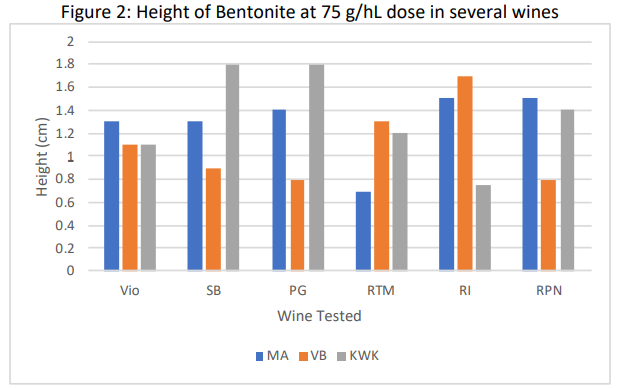
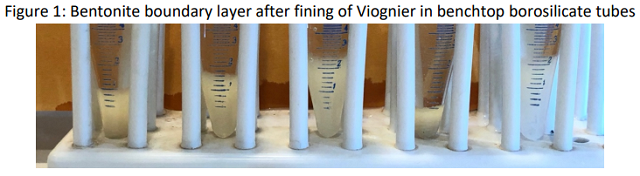
The results of the compaction trial varied considerably among bentonite products (Table 4, Figure 2). In addition to the volume of the lees, a relative “fluff index” was recorded as an indication of the clarity of the boundary layer between bentonite and wine. For example, in Figure 1, tube #3 has a fluffy boundary while tube #4 has a much more discrete boundary. The overall loss of wine is proportional not only to the lees themselves but also the difficulty of the racking operation. This observation is meant to reflect the probable relative ease of racking. A low number indicates very compact lees, a high number indicates fluffy lees. The compaction rate and fluff index were observed 24 hours and 1 week after tubes were initially fined with bentonite.
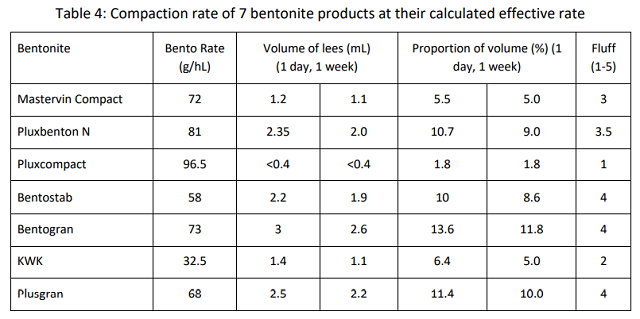
Despite having the highest rate of effective dose (96.5 g/hL), Pluxcompact had the lowest volume of lees (<0.4%) and the clearest boundary between lees and wine, indicating there would be the least amount of loss from this product. The products that advertise for compaction (Pluxcompact and Mastervin Compact) had the lowest proportion of loss for their effective rates. KWK also had a low level of volume loss, and a relatively low fluff index. This is likely due to its overall lower addition rate.
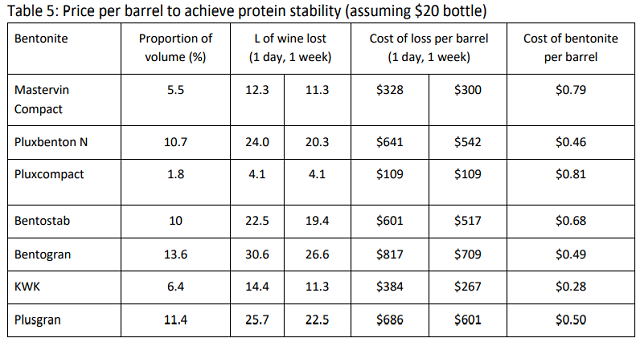
An overall cost of wine loss per barrel was calculated using the effective dose and cost of each bentonite product, and the compaction rate (Table 5). For a wine that will sell for an average of $20 per bottle, the difference in volume loss from various bentonite products resulted in a difference of hundreds of dollars in lost revenue. Also, the cost of wine loss due to poor compaction vastly overshadowed any cost of the product itself.
Fining trials, sensory analysis and esters
Methods
Four different bentonite products, Mastervin Compact (Vason), Pluxcompact (Enartis), Bentogran (AEB), and KWK (ATP) were used to treat barrel-fermented Viognier at the effective rate previously determined for each bentonite product, then analyzed for sensory effects and ester profile.
The same barrel fermented Viognier wine was divided among 5 carboys for treatment. Each carboy was treated with one of the bentonite products at the previously determined effective rate for that product. One carboy was left untreated as a control. Each product was prepared according to its own product instructions prior to addition to the carboy.
Carboys were allowed to settle for 1 week after which wine was racked off bentonite for tasting at a WRE sensory session. A sample of each fined wine was sent to an outside lab for analysis of protein stability as well as analysis of esters.
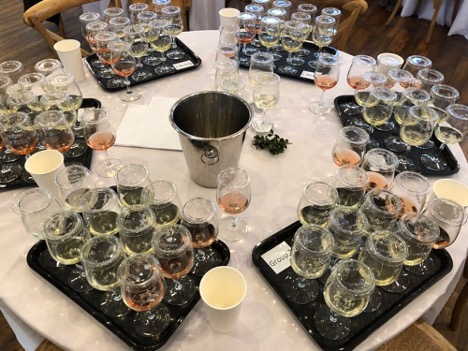
Sensory analysis was completed by a panel of wine producers at two separate sensory sessions. Wines were presented blind in randomly numbered glasses. There were three groups per session, each with a different order of presentation of the wines.
At the first sensory session, tasters were presented with five wines in a single flight, one of each treatment, and asked to rank the wines in order of aromatic intensity. Tasters were then asked to score each wine on a scale of 0 to 10 for aromatic intensity and body. They were also given open ended questions to describe the wines. Ranking data was analyzed using a Friedman’s test and descriptive scores were analyzed using repeated measures ANOVA.
At a second tasting event, wines were once again presented blind in random numbered glasses. Tasters were presented with two flights, each with a control and three other wines. They were asked to rank the other wines for their overall difference from control as well as their overall aromatic intensity. A control was included as an unknown in each flight.
Results
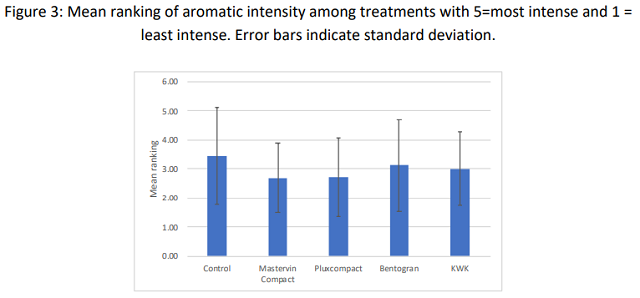
When asked to rank the wines for aromatic intensity, the control (unfined) wine had the highest average ranking; KWK the next highest. However, the variation in the data was large, and none of the differences in ranking were significant (Q=2.65, p=0.62)(Figure 3). There were also no significant differences in scores for aromatic intensity or body.
At the second tasting, tasters were given a control and asked to score the remaining wines against this control in two separate flights. In each case, a control wine was also given as a sample. If the wine was truly different, its difference score should be higher than the blind control. This was not the case for any of the treatments tested, indicating no significant differences among the wines. Descriptive scores for aromatic intensity were also not significantly difference from control (Figure 4).
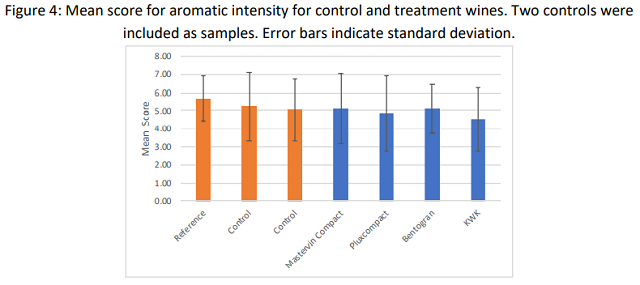
Very large standard deviations are apparent from both sensory sessions. Ranking of five wines is a difficult tasting task. More discrete differences may have been apparent with a trained panel of tasters under more controlled conditions.
Wines were also analyzed for esters after fining (Table 1). Differences larger than 10% are shown in bold. Only 8 out of 65 levels measured differed by more than 10%, and only one differed more than 20%. Esters are not the only compounds with organoleptic impact, but they do constitute one group with significant impact on aroma and flavor of wine.
Protein Stability Bench Trials on Sauvignon Blanc
Methods
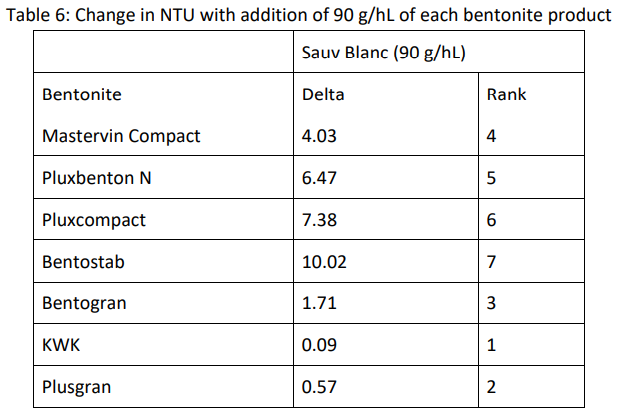
In order to investigate if bentonite efficiency results were consistent between wines, a second wine was chosen for an abbreviated bench trial. A 2018 Sauvignon Blanc was initially tested for instability and was found to have a change in NTU of 57, predicting a rate of 90 g/hL of bentonite using Duleau’s formula10. This is well within the range commonly used in Virginia Sauvignon Blanc. The wine was fined with each product at 90 g/hL to assess change in turbidity at this rate.
Results
Only three of the products achieved stability (∆NTU<2.0) at 90 g/hL (Table 6). Plusgran and KWK had very low levels of turbidity at this rate, therefore it is likely that these wines were overfined and stability could have been reached at a lower rate of addition.
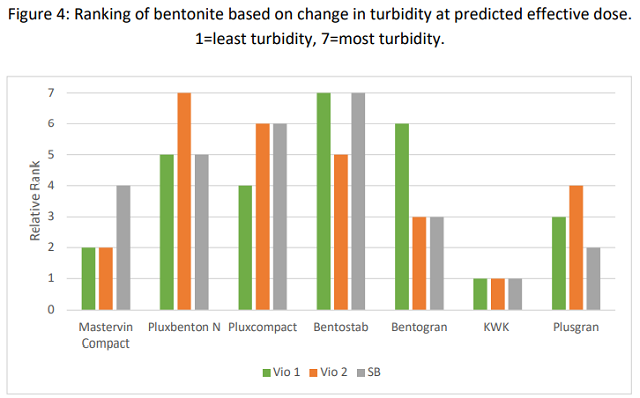
To determine if there is a trend in overall efficacy per gram, bentonites were ranked according to change in turbidity at the predicted effective dose for each of the three trials (30 g/hL for both Viognier trials, 90 g/hL for Sauvignon Blanc)(Figure 4). A low ranking indicates lower change in turbidity. KWK had the lowest turbidity relative to dose in all three trials, indicating it has the best binding efficacy per gram of product for these wines. Mastervin Compact had the second lowest the Viognier trials but not the Sauvignon Blanc. Beyond this, rankings were not consistent among bentonite products, indicating a large variation in efficacy based on the matrix of the wine and the conditions of the test. This is consistent with the findings of Dourdoni et al (2015) as well as Marchal et al (2019) and Blateyron et al (2007). The complexities of the wine matrix and bentonite mean that no one equation predicts the binding outcome and products will interact with different wines in different ways.
Conclusions
- Protein binding efficiency in this Viognier, as defined by the ability to achieve protein stability, differs greatly among bentonite products with a range of 30-100 g/hL found among 7 products.
- Swelling time of bentonite affects the results of bench testing. When swelled according to manufacturer’s instructions, as would occur in the cellar, bentonite had lower binding efficiency than stock solutions stored for one week.
- Benchtop stability tests were not precise, with notable differences when tests were done on the same wine with the same bentonite at a different time. If the goal for a wine is complete protein stability, for example if CMC is to be used, it is recommended a second test be performed after bentonite fining of the wine to ensure stability has been reached. A subsequent newsletter will explore accuracy of protein stability testing in more detail.
- The main difference in cost between bentonite products was not the cost of the product itself, but rather the cost of wine lost during fining.
- Products marketed for compaction had higher overall rate of bentonite addition but very low volume loss.
- KWK had relatively good compaction, likely due to the low dose needed to achieve protein stability in this wine
- No significant differences in sensory characteristics were detected in two sensory sessions.
- Esters were not notably different among the bentonite treatments.
- When bentonite products were ranked for binding efficiency by wine, no clear patterns emerged, indicating efficiency might be wine dependent.
References
(1) Zoecklein, B.; Fugelsang, K. C.; Gump, B. H.; Nury, F. S. Wine Analysis and Production; Springer: New York, 1995.
(2) Jackson, R. S. Wine Science: Principles and Applications, 4 edition.; Academic Press: Amsterdam, 2014.
(3) Dordoni, R.; Colangelo, D.; Giribaldi, M.; Giuffrida, M. G.; De Faveri, D. M.; Lambri, M. Effect of Bentonite Characteristics on Wine Proteins, Polyphenols, and Metals under Conditions of Different PH. American Journal of Enology and Viticulture 2015, 66 (4), 518–530. https://doi.org/10.5344/ajev.2015.15009.
(4) Blateyron, L.; Meistermann, E.; Trottier, C. Stabilisation Proteique Des Vins Blancs et Rose: Etude Comparative Des Bentonites et Rechaerche d’une Approche Raisonnee Des Traitements. Congres OIV 2007.
(5) Vela, E.; Hernández-Orte, P.; Castro, E.; Ferreira, V.; Lopez, R. Effect of Bentonite Fining on Polyfunctional Mercaptans and Other Volatile Compounds in Sauvignon Blanc Wines. American Journal of Enology and Viticulture 2017, 68 (1), 30–38. https://doi.org/10.5344/ajev.2016.16052.
(6) Waters, E. J.; Muhlack, R. A.; Pocock, K. F.; Colby, C.; O’Neill, B. K.; Jones, P. Preventing Protein Haze in Bottled White Wine. Australian Journal of Grape and Wine Research 2005, No. 11, 215–225.
(7) Robinson, E.; Scrimgeour, N.; Marangon, M.; Muhlack, R.; Smith, P.; Godden, P.; Johnson, D. Beyond Bentonite. Wine and Viticulture Journal 2012, No. November/December, 24–30.
(8) Weiss, K. C.; Lange, L. W.; Bisson, L. F. Small-Scale Fining Trials: Effect of Method of Addition on Efficiency of Bentonite Fining. Am J Enol Vitic. 2001, 52 (3), 275–279.
(9) Marchal, R.; Voisin, C.; Jeandet, P.; Chatelain, F. Utilisation de modèles mathématiques pour optimiser les doses de bentonite gonflée et non gonflée lors du collage des vins blancs. Partie I: Clarification et stabilisation colloïdale. OENO ONE: Journal international des sciences de la vigne et du vin 2002, 36 (3), 169–176.
(10) Brugirard, A. Aspects Pratiques Du Collage Des Moûts et Des Vins; Oenoplurimédia, 1997.