Summary of Virginia Grape and Wine metrics 2014-2020

Joy Ting, Jessica Trapeni, Jenna Barazi, Corry Craighill, Franco Sferrella

November 2022

Summary Introduction Methods General Results – White Grape Varieties at Harvest Results – Red Grape Varieties at Harvest Results – Prediction of Wine pH Results – Vintage Variation in Cabernet Franc Results – Acetic Acid in Wine

Summary

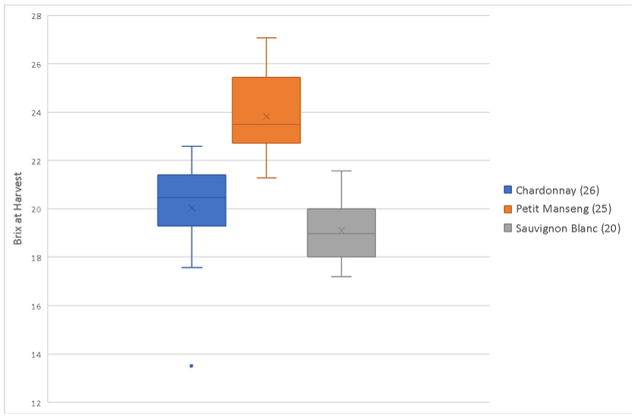
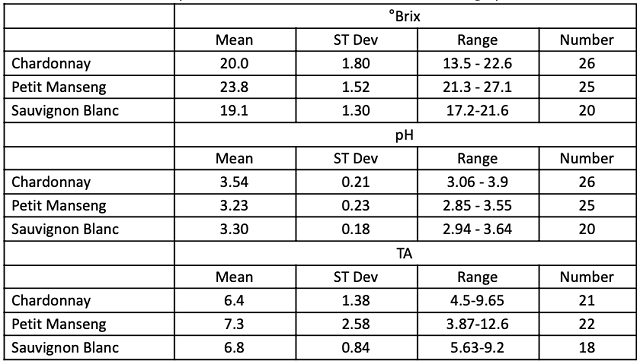
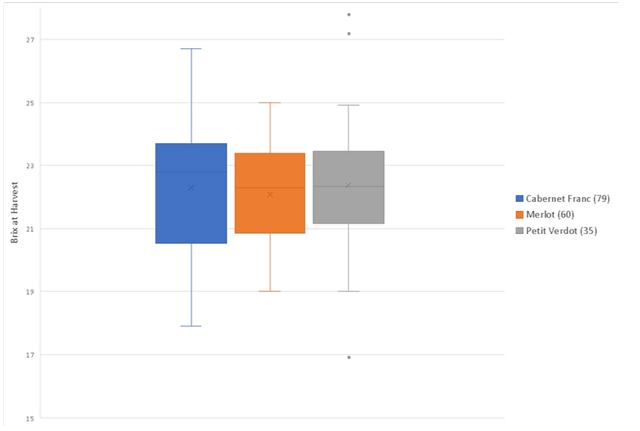
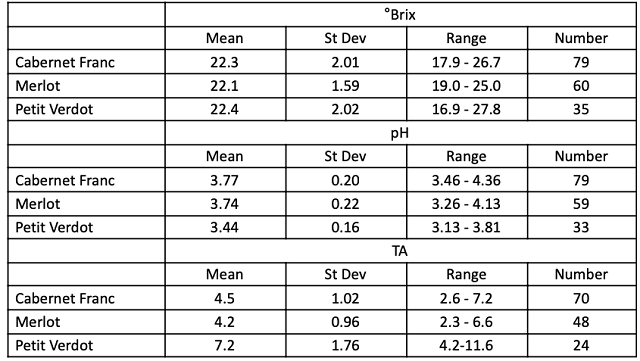
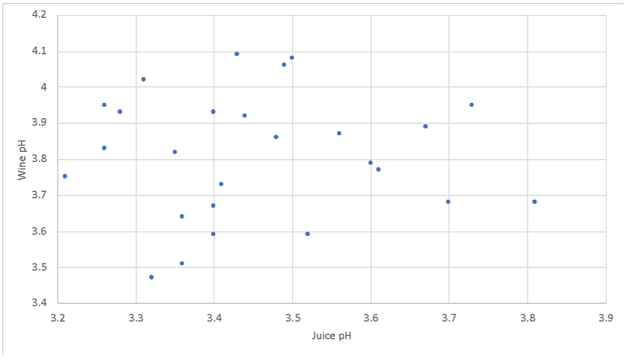
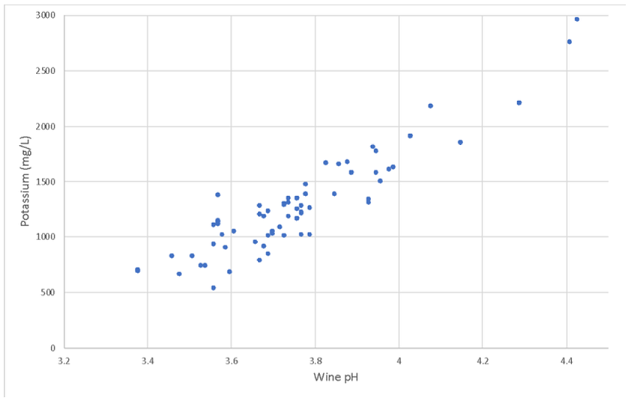
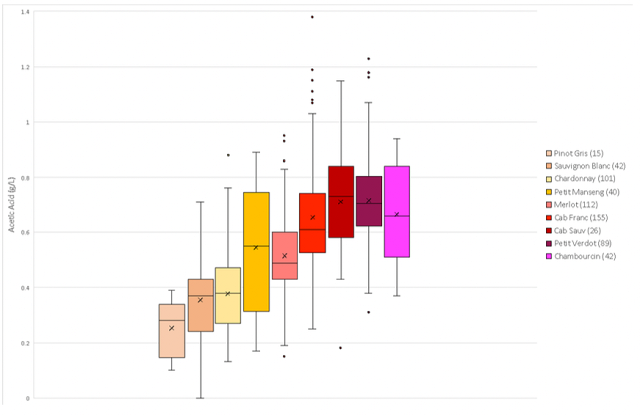
In its six years of operation, the Virginia Winemakers Research Exchange has gathered data on grapes and wine as part of evaluating more than 300 practical vineyard and winery experiments completed throughout the state of Virginia. These data were initially reported with the experiments for which they were measured. The objective of this project was to gather these disparate sets of data into a single organized, searchable database and report summary statistics such as average, variation, and range for use by growers and winemakers to evaluate vineyard practices, grape pricing, winemaking decisions, and when interpreting future laboratory results. To complete the proposed analysis, electronic infrastructure was programmed to allow for fast, easy and accurate data entry by several parties into a centralized database for all WRE projects. All available data from past WRE projects were located and entered in the database. The existing dataset was analyzed to report summary statistics for metrics of interest and a workflow was planned for ongoing data entry in subsequent years. The database currently contains 856 unique entries from experiments conducted from 2014 - 2021. For white grapes, Sauvignon Blanc was harvested at the lowest Brix on average, while Petit Manseng had the highest Brix but lowest pH in the comparison. Red grape varieties showed a wide range of Brix at harvest within varieties, with very similar mean values between varieties. Though Petit Verdot was harvested with overall lower pH and higher titratable acidity than other red varieties, there was no correlation between the juice pH and pH of the finished wine. There was a strong correlation between potassium and wine pH (R²=0.845). On average, white wines complete fermentation with lower acetic acid than red wines, though more than 50% of the Petit Manseng wines used in WRE experiments completed fermentation with acetic acid above 0.5 g/L. The limit of detection for acetic acid in red wines is considered to be near 0.7 g/L. The average values for all of the reds except Merlot are at or near this threshold.

Download Report

Introduction

Most wineries, including those in Virginia, rely on basic metrics for grapes and wine (brix, pH, TA, alcohol, malic acid and volatile acidity) to guide decision making. Some utilize additional metrics such as anthocyanins, phenolics, and water content. Whether these data are generated in-house or by a service lab, it is the responsibility of the grape grower and winemaker to interpret the results of these tests to make actionable decisions. Interpretation is based on the producer’s own background and experience with a given grape variety, vineyard, or region. Good decision making, however, is sometimes hindered by the lack of appropriate benchmarks for Virginia fruit. 

Winemakers and grape growers have several sources of information for expected ranges of these metrics, but none are fine tuned to Virginia. Textbooks such as Jackson’s Wine Science1 and Zoecklein’s Wine Analysis and Production2 list ranges of expected values for harvest Brix, pH of grapes and wine, and other constituents such as potassium and phenolics. However, each of these values is known to vary dramatically from region to region. For example, in their paper on the impact of grape maturity and ethanol concentration in sensory properties of Washington State Merlot wines, Sherman et al3 considered wines of harvest Brix 20.5°Bx, 24°Bx, and 27°Bx in Merlot. Those harvested at 20.5°Brix were considered underripe while those at 24° Brix were “normal”. In many Virginia vineyards, Merlot harvest is rarely above 22°Bx, though these wines would not be described as underripe by the other (sensory) metrics used by Sherman et al. In the same paper, a harvest pH of 3.73 was considered normal for Merlot, whereas in Virginia that would likely be considered high. Similar difficulties exist when assessing metrics from textbooks, which are usually gleaned from primary literature of a single region or present such broad averages as to be too general.

The availability of benchmarks taken from historic datasets of Virginia fruit might be used by grape growers and winemakers on several occasions:

  • Defining quality parameters for grape pricing

  • Evaluation of vineyard performance relative to neighbors and over time 

  • Defining vintage variations with quantitative measurements

  • Negotiating harvest decisions between growers and wineries

  • Evaluating winemaking techniques and approaches with benchmarked quality parameters

  • Identifying problem areas in the winery

  • Generating questions for further study

  • Evaluating Virginia wines in relation to benchmarks from other regions

Before any analysis can be made, several cautions must also be stated. 

  • These data were taken by different labs, including many different winery laboratories as well as several service labs. Some variation in values is expected due to differences in operators, equipment and protocols.

  • All data reported are from previous WRE experiments. Despite efforts to include vineyards and wineries from around the state, experiments are not necessarily a representative sample of the industry as a whole. 

  • The dataset is still very small relative to the number of variables involved in how the data were generated. Some differences or trends may be due to chance.

  •  Correlation does not equal causation. Any interesting trends hinted at by these data should be followed by rigorous testing prior to any firm conclusions.


References

(1) Jackson, R. S. Wine Science: Principles and Applications, 4 edition; Academic Press: Amsterdam, 2014.

(2) Zoecklein, B.; Fugelsang, K. C.; Gump, B. H.; Nury, F. S. Wine Analysis and Production; Springer: New York, 1995.

(3) Sherman, E.; Greenwood, D. R.; Villas-Boâs, S. G.; Heymann, H.; Harbertson, J. F. Impact of Grape Maturity and Ethanol Concentration on Sensory Properties of Washington State Merlot Wines. Am J Enol Vitic. 2017, 68 (3), 344–356.

Methods

For each VWRE experiment, appropriate laboratory analyses are sent to certified service labs including ICV labs in Toulouges, France, ETS labs in St. Helena, California, and the enology services lab at Virginia Tech. In-house assessment at wineries including harvest measures for fruit and general chemistry is also reported. A typical VWRE experiment provides data for juice, fermentation kinetics, and finished wine chemistry. Some projects also include reporting of ripening kinetics, phenolics, microbiology, esters or thiols.

In order to facilitate a searchable database, all prior and current projects were assigned a unique identifier that allowed cross-referencing back to the research report for further information on the study. Use of a Unique ID allows future users of the database to better understand the context from which the data arose. For example, though coded as “Cabernet Franc”, fruit information from project 18-071 Developing a protocol for Rosé stabulation using Laffazyme THIOLS (Laffort) and Fermoplus Tropical (AEB)(2018) would be inappropriate to use for an analysis of Cabernet Franc Brix at harvest, since this fruit was harvested for Rosé rather than red wine. All supporting reports are available on the WRE website.

Jessica Trapeni, (Imbibe Solutions & Oakencroft Vineyards) programmed a single master Google Sheet to house data for each project. Date from each project was entered using the Unique ID, allowing for searching and filtering by any grape or wine metric. Wine and cider experiments utilize different metrics and are compiled in two different spreadsheets. Corry Craighill (Septenary), Franco Sferrella (Veritas Vineyards) and Jenna Barazi (WRE) entered the first round of data into the spreadsheet. Metrics for experiments conducted from 2014-2018 were obtained from the research reports. These were manually entered into the database. Data from 2019-2020 were added using direct downloads from Vintrace, a winery software system piloted in that season. 

To facilitate better data entry for current and future projects, Ms. Trapeni programmed a series of translators that allows batched uploads of service lab data as soon as they are reported. Each service lab reports data in its own format. The translators transform these data into a common format that can be cut and pasted into the master sheet. The WRE typically sends batches of samples for analysis that can number from 10-30 samples. Direct upload streamlines the time needed for data entry while minimizing potential for error. Inputting data “on time” has become part of the normal workflow of the Exchange Coordinator (Jenna Barazi), ensuring the spreadsheet will be kept up to date for years to come. Timely uploads also allow for better interpretation when data do not match previous uploads or need further explanation. 

Data inputs through the 2020-2021 season were complete as of March 2022. At that time, both the Research Enologist and Exchange Coordinator began using the database for normal WRE operations. For example, the database was used to determine average potassium of finished wines when preparing for a sensory session held in May 2022. This season of beta testing revealed several bugs that were subsequently fixed. For example, one service lab sometimes reports potassium and tartaric acid levels and sometimes does not. This discrepancy caused erroneous formatting for the translator for that lab, as it was initially programmed to look for a specific order of metrics. Changing the way data was looked up by the translator to include the name of the metric rather than just its position in the original list fixed the problem. Other bugs included labs using different names for the same metric when they were associated with different testing panels. As bugs have been found, Ms. Trapeni has been consulted to work around or fix the problem. Beta testing is ongoing.  At the time of this report, all data have been entered through experiments initiated in the 2020-2021 experimental period. 

To determine metrics at harvest for red and white varieties, the database was sorted for the specific variety under investigation. Metrics for all unique ID’s with a Brix value listed were cut and pasted to a new spreadsheet. Unique ID’s were screened to ensure values were not duplicated. For experiments when a single juice was split into multiple treatments, juice metrics were only used once. Calculation of mean and standard deviation was done using Microsoft Excel. Linear regressions were calculated by XLStat. Summary statistics were prepared for varieties with adequate number of observations only.


General

The database currently contains 856 unique entries. A single experiment generates multiple entries based on the number of different treatments within the experiment. For example, a simple trial comparing the performance of two strains of yeast would generate entries with two different Unique ID’s, one for each yeast strain. Database categories include metrics from juice panels, wine panels, phenolic panels, and microbiological panels (Table 1). Not all entries include data from all panels. The above example might include a juice panel and general wine chemistry but not a phenolic panel or wine microbiology. Moving forward, data entry will be ongoing, with all data from a given experimental year entered into the spreadsheet as part of annual reporting. After data entry is complete for a given season, summary statistics will be updated.

Table 1: Metrics included in analysis panels


Box and whisker plots were used to visually represent summary statistics for this report. When looking at this type of graph, the area within the box represents the median 50% of the values in the data set while the upper and lower 25% of the values in the data set are plotted as extensions from the box. The upper and lower extreme of the data are represented by whiskers capping each extension. Data that are statistically outside the spread of the rest of the data (i.e. outliers) are plotted as dots. The wider the box, the wider the range of variation in the data. The median value is represented by the line inside the box while the mean is represented by the x inside the box. (Figure 1). Numerical values for summary statistics can also be found in accompanying tables.

Figure 1: Example box and whisker plot. From: Data visualization catalogue (datavizcatalogue.com)

Results – White Grape Varieties at Harvest

Average Brix, pH, and TA at harvest for the three most common white varieties in the dataset (Chardonnay, Petit Manseng, and Sauvignon Blanc) are shown in Figure 2 and Table 2.  Sauvignon Blanc was harvested at the lowest Brix on average, while Petit Manseng had the highest Brix but lowest pH in the comparison. Chardonnay Brix values may be decreased by the presence of sparkling wine picks in the dataset.


Figure 2: Brix at harvest for three white grape varieties

Table 2: Summary statistics for harvest metrics of three white grape varieties

Results – Red Grape Varieties at Harvest

Cabernet Franc, Merlot, and Petit Verdot were the most reported red varieties in the dataset. Each of these varieties showed a wide range of Brix at harvest, with very similar mean values (Figure 3, Table 3). Cabernet Franc has the widest variation in harvest Brix, but this may be an artifact of the larger number of observations for Cabernet Franc relative to other varieties. 

Figure 3: Brix at harvest for three red grape varieties

Table 3: Summary statistics for harvest metrics of three red grape varieties


Results – Prediction of Wine pH

Though Petit Verdot is harvested with overall lower pH and titratable acidity (Table 3), there is no meaningful correlation between the juice pH and pH of the finished wine (R²=0.007) (Figure 4), indicating that pH in the finished wine is strongly affected by factors other than juice pH. There is also no correlation between juice and wine pH for Cabernet Franc (R²=0.050)(data not shown). Potassium is one likely factor determining wine pH. Juice potassium is very difficult to measure, however wine potassium and wine pH show a fairly strong positive correlation (R²=0.845) (Figure 5). Generally, wine potassium values below 1200 mg/L were found in wines with pH values below 3.8, while wines with higher potassium had pH values closer to 4.0. Several WRE experiments in 2020-2022 explored the prediction of wine pH using juice potassium.

Figure 4: Comparison of the pH at harvest vs. pH of finished wine in Petit Verdot

Figure 5: Correlation of wine pH and wine potassium (R²=0.845)

Results – Vintage Variation in Cabernet Franc

To visualize vintage effects, harvest Brix for Cabernet Franc, the most commonly reported red variety, were further sorted and plotted by vintage (Figure 6). Not surprising due to heavy rains, 2018 had notably lower Brix at harvest relative to other vintages. Despite very strong growing conditions in 2017 and 2019, there were still some examples of very low Brix at harvest.


Figure 6: Cabernet Franc °Brix at harvest over 5 vintages

Results – Acetic Acid in Wine

Acetic acid in finished wine is an important metric of wine quality. Figure 7 and Table 4 show the average acetic acid in finished wine for 9 varieties. On average, white wines complete fermentation with lower acetic acid than red wines, though more than 50% of the Petit Manseng wines used in WRE experiments completed fermentation with acetic acid above 0.5 g/L. The limit of detection for acetic acid in red wines is considered to be near 0.7 g/L1. The average values for all of the red varieties except Merlot are at or near this threshold. There is a significant positive correlation between acetic acid and both ethanol (F=63.58, p<0.0001) and pH (F=232, p<0.0001), meaning that the higher the ethanol and pH, the higher the acetic acid in the wine. However, both correlations are weak (R²=0.076 and 0.231 respectively) meaning that many other factors also influence acetic acid production.

Figure 7: Average acetic acid in wine for 9 varieties

Table 4: Average acetic acid in wine for 9 varieties


Contact

Sign up for our Mailing List