SO2 Measurement Methods

Joy Ting

January 2022

Why we measure SO2 How we measure SO2 Comparison of Methods Most methods overestimate free SO2 in red wines! Video: SO2 Measurement and Management

Why we measure SO2

Joy Ting

January 2022

Sulfur dioxide is a traditional, inexpensive additive used widely at many different stages of modern wine making to combat oxidation and microbial spoilage. It can be used pre-fermentation to control microbial populations that come in on grapes and the oxidation of juice, post-fermentation to protect wine from oxidation and spoilage during aging, for storage of barrels to prevent microbial spoilage, and even as a general cleaning agent in the winery (sprays on surfaces, etc…).

When used in the winery, SO2 is most often in a liquid form. When SO2 dissolves in water, it doesn’t remain only as SO2. Instead, it interacts with the water in a way that takes three forms: molecular sulfur, bisulfite and sulfite. Figure 1 gives a graphical representation of the relationship between pH and the forms of sulfur dioxide. Between pH of 3 and 4, which describes most wine, bisulfite is the predominant form of sulfur dioxide while molecular sulfur and sulfite are scarce1. The balance of forms is important because not all forms of sulfur dioxide have the same activity. 

Figure 1: Forms of sulfur dioxide in solution are pH dependent. Image from Rotter n.d2.


Molecular sulfur (SO2) is prized because of its antimicrobial activities. As the only form of sulfur dioxide that is not charged, molecular sulfur can penetrate the cell membranes of microbes and cause cellular damage and death.1,3,4 Molecular SO2 is also volatile, which means this is the form that can cause negative sensory aromas in the headspace of wine and can be lost during aging as it diffuses into the headspace of barrels and dissipates1. The volatility of molecular SO2 is also the basis for separation from the wine matrix during aeration oxidation testing, and is the form detected in the headspace gas detection tube method of analysis.

The bisulfite form of sulfur dioxide (HSO3-) dominates at wine pH. Bisulfite is a potent inhibitor of enzymes that causes enzymatic browning in juice and wine4. However, bisulfite binds to many constituents in the wine including acetaldehyde, anthocyanins, and sugars1,3,4. Once bound, it is no longer active as an antioxidant. This binding is not irreversible, however. Under very acidic conditions and high heat, bisulfite is released. This is the basis of total SO2 testing, but can be erroneously counted as free when acid is used during free SO2 testing such as aeration oxidation and Ripper titration.

SO2 testing is one of the most common analytical tests performed in wineries, with addition rates relying on the results of these tests. Most wineries test for both free and total sulfur dioxide. Free SOrefers to any form of SO2 in wine that is not bound to another molecule and gives an indication of the antimicrobial and antioxidant protection conveyed to the wine. Total sulfur includes both the free and bound fractions. The legal limit for total SO2 is 350 ppm, however most wineries limit total SO2 to 200 ppm for sensory reasons4,5. Free SO2 targets depend on the antimicrobial and antioxidant goals. A general rule of thumb is to maintain a molecular SO2 between 0.5 and 0.8 mg/L for antimicrobial properties6,7. It is also recommended to keep free SO2 above 10 ppm in red wines and 20 ppm in white wines to avoid oxidation3. Because the bisulfite form of SO2 binds readily to many common constituents of wine, free SO2 cannot be calculated from SO2 additions but rather must be measured. There are several methods currently in use for measuring free SO2. The principles behind these tests and potential problems with each test are the topic of the remainder of this newsletter. For more detail into the chemistry of SO2, target SO2 levels and management strategies, see the July 2020 Newsletter on SO2 Management.

Figure 2: Forms of free and bound sulfur dioxide in wine. From Zoecklein8


References

(1) Boulton, R.; Singleton, V. L.; Bisson, L. F.; Kunkee, R. E. Principles and Practices in Winemaking; Chapman and Hall, Inc: New York, 1996.

(2) Rotter, B. Sulfur Dioxide. Improved Winemaking: advanced theory, practical solutions and opinions.

(3) Ribereau-Gayon, P.; Dubourdieu, D.; Doneche, B.; Lonvaud, A. Handbook of Enology Volume 1: The Microbiology of Wine and Vinifications, 2nd ed.; John Wiley & Sons: West Sussex, England, 2006.

(4) Zoecklein, D. B. Sulfur Dioxide (SO2). Enology Notes Downloads, 16.

(5) Stamp, C. How Much SO2 to Add and When. Wines and Vines 2011.

(6)        Margalit, Y. Concepts in Wine Chemistry, 3rd ed.; The Wine Appreciation Guild LTD: San Francisco, California, 2012.

(7)        Cojocaru, G.; Antoce, O. Chemical and Biochemical Mechanisms of Preservatives Used in Wine: A Review. Sci. Pap. Ser. B: Hortic. 2015, 56, 457–466.

(8)        Zoecklein, B. W. Sulfur Dioxide: Science behind This Antimicrobial, Antioxidant, Wine Additive. Practical Winery and Vineyard Journal 2009.

How to measure free SO2

Joy Ting

January 2022

Free SO2 testing is likely the most common laboratory test performed in wineries regardless of size, with addition rates determined based on the result. In a 2019 survey of winemakers attending a WRE seminar on SO2 management, most Virginia wineries (90% of respondents) are measuring SOin-house using aeration oxidation (50%), Ripper titration (30%), or autotitration (20%), which is a modification of the Ripper method. Unfortunately free SO2 tests do not come with standard solutions because we cannot fix SO2 in the free form, eventually it will bind up and no longer be free. So how reliable are our results? Which of the available methods is best, and can a winemaker be sure he/she is working with a reliable number? In this newsletter we will examine the different methods for measuring free SO2 in a small to medium sized winery, discuss quality control measures and pros and cons of each approach. Specific protocols may differ among wineries, but these basic principles will apply broadly. For specific protocols to use in your own winery, we recommend those found in “Chemical Analysis of Grapes and Wine” (Iland et al 2004) and Wine Analysis and Production (Zoecklein et al 1995), though several textbooks and lab manuals will contain good examples.


Regardless of which method you use, it is important to use the appropriate measurement device. Any lab method has a limit to how robust it is to changes to the procedure1. Some steps require very careful measurement while others do not. If the protocol calls for dilution with a volumetric flask, this tells you that there is little room for error in this step. Volumetric pipettes are more accurate than transfer pipettes, and transfer pipettes are far better than graduated cylinders. It is worth the limited expense to purchase the appropriate measurement device in order to ensure a more accurate and precise result.


Ripper Titration 

The Ripper method relies on a redox reaction between sulfur dioxide and iodine. The wine is first acidulated with sulfuric acid to reduce cross reaction of iodine with wine polyphenols2. Starch is added as an indicator that will turn color when it complexes with iodine. When Iodine is initially titrated into the wine/acid/starch mixture, sulfur dioxide from the wine reacts with iodine before it can complex with the starch, so there is no color change. When all of the sulfur dioxide has been complexed with iodine, excess iodine reacts with the starch to form an inky black end product, indicating the end to the titration. Based on the volume of iodine used, the amount of sulfur dioxide can be calculated with a simple conversion factor based on the concentration of iodine2–4.

There are several elements to the Ripper titration that make it attractive for the small to medium sized winery. The entire procedure if very fast, it requires very little equipment (a burette, a flask, a pipette and a desk light, Figure 1), and it is very inexpensive (Table 1). However, there are several known inaccuracies with this approach. Once acidulated, SO2 is volatile and can be lost from the liquid/air interface during swirling4. Determination of the endpoint by a color change can be difficult in deeply colored red wines. Most importantly, there are other compounds in the wine matrix that also bind to iodine, most notably phenols, sugars, aldehydes, and ascorbic acid. This leads to an overall overestimation of SO2 present2,3.

If you are using the Ripper titration, there are some steps to take to make it as accurate as possible. A pinch of bicarbonate can be added to blanket the liquid/air interface with CO2, making volatilization of SO2 and dissolution of O2 less likely2,3. A small desk lamp can be used to provide backlight to the titration, making endpoint determination easier. Due to the instability of iodine, the concentration of this solution should be checked weekly, or potassium iodate could be used in its place to create iodine in situ5.

General QC recommendations also include 

  1. Store iodine in a dark cabinet in dark glass bottle since it is light sensitive or the refrigerator to avoid microbial contamination2
  2. Standardize the iodine solution as it will degrade over time (with an estimated shelf life of 3 months when stored properly). Iland et al 2004 has a good protocol for this.
  3. Though some kits supply a syringe for titration of iodine, it is better to use a microburette with a narrow bore opening to fine tune the titration.
  4. The endpoint is reached when the color changes to a dark blue and persists for 30 seconds.
  5. Work quickly (within 2 minutes) to avoid volatilization of SO2 at low pH and dissociation of SO2 bound to anthocyanins2,5

ORP detection methods

Several manufacturers, including Vinmetrica and Hanna Instruments, have developed oxidation/reduction sensing probes that detect a change in the current of the wine in the presence of excess iondine6. Sensing redox potential as opposed to a color change allows a better determination of the reaction endpoint in darkly colored wines2. The Hanna Instruments autotitrator also reduces human error by automating the titration step. However, since these methods still rely on the Ripper method, they are still subject to interferences from other wine components and iodine should be used promptly or standardized.

Aeration Oxidation

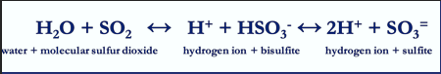
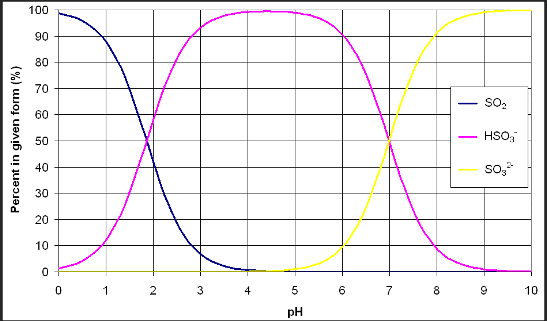
The aeration oxidation method seeks to avoid interferences by other components of the wine matrix by separating SO2 from the wine prior to measurement. During AO, acid is added to wine which is then subjected to either negative pressure (vacuum) or positive pressure (bubbling air) that separates molecular SO2 from the liquid. This gaseous SO2 passes through tubing to a second receptacle where it is trapped by a hydrogen peroxide solution, forming sulfuric acid. Because the wine is initially acidulated, most of the SO2 is in the molecular form and therefore measurable. After a measured amount of time (dependent on flow rate), the amount of sulfuric acid in the peroxide trap is determined by titration with NaOH. Though this methodology still relies on a color change to determine the end of titration, the peroxide solution is clear and therefore the endpoint is easier to read than in the Ripper titration2,3. However, several other difficulties remain

Aeration oxidation requires a more elaborate setup than the Ripper titration (Figure 1) with higher initial cost and longer reaction time (15 minutes per test). It still relies on a trained technician to accurately determine the endpoint, and care must be taken to keep solutions up to date. Because this method relies on separation by air movement, the flow rate of air through the wine must be calibrated, and the reaction must be carefully timed as too much or too little will affect the resulting value. When setting up the reaction, all tubing must be secure as any leaks will cause SO2 to escape, leading to aberrantly low values2–4.

General QC recommendations also include:

  1. Standardize NaOH often. Some recommend daily3, some say weekly4. Iland et al (204) recommend purchasing 0.1 M NaOH, which is more stable, and diluting to 0.01 N NaOH as needed, however this dilution must be done volumetrically to avoid error. NaOH can also be made from dry pellets at less cost and then standardized2–4.
  2. Hydrogen peroxide also degrades quickly in air, so a stock solution of 30% peroxide should be purchased from a trusted chemical supplier and stored in a dark bottle away from sunlight. A working solution of 0.3% should be made up at the time of use2,3.
  3. Store NaOH and Hydrogen peroxide in the refrigerator to slow degradation, but make sure working solutions are used at room temperature3
  4. All testing should occur at cellar temperature3.
  5. Do not use NaOH that has been sitting in the burette overnight or for several hours. Good practice is to drain the burette at the end of each testing session. When refilling, make sure to flush any remaining solution completely, refill, and make sure to remove any air bubbles before titrating.
  6. The endpoint is reached when the magenta solution shows the first appearance of olive green. If you get to bright green, you have gone too far3.
  7. The flow rate of air should be 1L/minute.

Spectrophotometer based methods

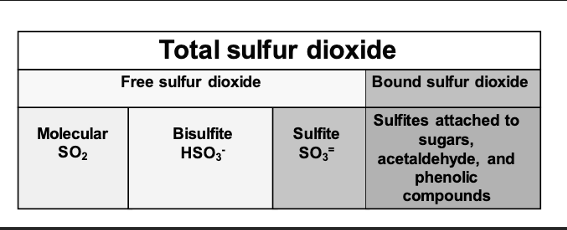
In recent years, a third category of free SO2 determination has become available to the medium sized winery. This methodology relies on a quantitative reaction of bisulfite in the wine with fucsin and formaldehyde to produce a colored compound that can be measured with a spectrophotometer*5,7. A standard curve is built using standard solutions allowing for calibration within the protocol. Many medium sized wineries use spectrophotometers for measurement of volatile acidity, malic acid, residual sugar and juice nutrients, so this methodology adds one more function to this instrument. The reaction itself has been condensed into kit form by several manufacturers (Unitech, Vinessential, Megazyme and others) and can be run with an automated protocol on instruments such as the Chemwell. Several QC protocols are included in the kit procedure including sample blanking to avoid absorbance by polyphenols and pigments and use of a second reading to determine true SO2 vs. other oxidizable compounds that have reacted with reagents. 

This methodology has been shown in internal documentation to be within 7ppm of traditional measures (Ripper and AO), with average differences of 1.5ppm for Chardonnay and 5ppm for red wines, with lower variation than either traditional metod5. However, this study was done on an automated spectrophotometer, which comes at considerable cost ($11,000-25,000 at the time of this writing). Package inserts from Megazyme and Vintessential also taut close correlation (r2=0.999) with results from AO measures of the same wine, leading to average differences of 1 mg/L (SD 4 mg/L). These kits can be used with a manual spectrophotometer, allowing several reactions to be processed in one run (decreasing time per test), however, manual operation includes the need for a trained technician as well as introducing potential error from pipetting, timing, cuvette cleanliness, etc… In a review of laboratory proficiency over 13 years and over 70 laboratories, Howe et al (2015) found spec based methods for free SO2 determination had very high values for variation. These authors hypothesize high values are due to a combination of factors including poor calibration of the spectrophotometer, pipette calibration, inappropriate cell path length, and dilution errors.

*The Vintessential kit relies on a different reaction than the Unitech and Megazyme kits. This approach includes acidification of the sample, leading to issues of bisulfite dissociation that will be discussed in the “Headspace” portion of this newsletter. Other aspects of the protocol (potential for automation, pipetting error, etc…) will apply to this kit.

Other methodologies

Several other methodologies for detection of sulfur dioxide in wine have been investigated8–11, however, most are either not yet ready for the production laboratory or they require expensive instrumentation and skilled operators that place them out of reach for small to medium sized wineries. These approaches are exciting developments and will be reported on as they become accessible for Virginia winemakers.

Figure 1: Comparative glassware needs and setup for the Ripper titration and Aeration Oxidation testing ($395) (www.carolinawinesupply.com)(gillypad.weebly.com)


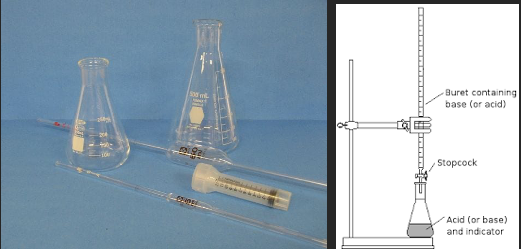
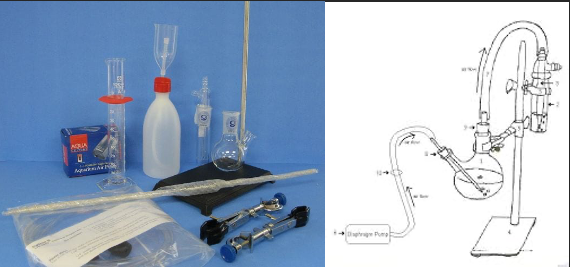
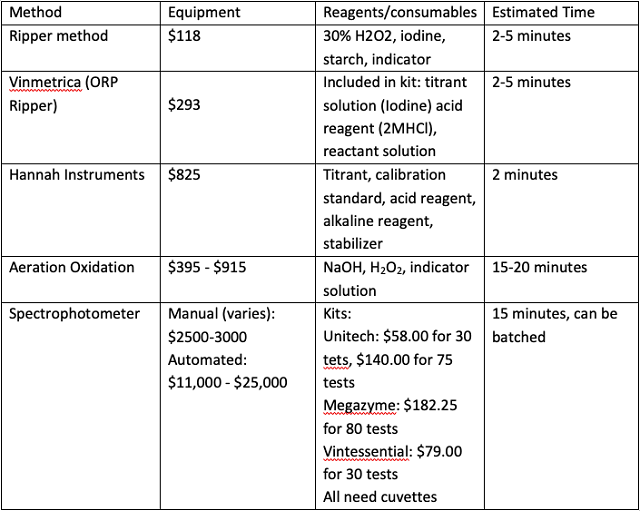
Table 1: Comparative cost of materials and supplies for various methods of SO2 determination


References

(1) Butzke, C. E.; Ebeler, S. E. Survey of Analytical Methods and Winery Laboratory Proficiency. American Journal of Enology and Viticulture 1999, 50 (4), 461–465.

(2) Zoecklein, D. B. Sulfur Dioxide (SO2). Enology Notes Downloads, 16.

(3) Iland, P.; Bruer, N.; Edwards, G.; Weeks, S.; Wilkes, E. Chemical Analysis of Grapes and Wine; Patrick Iland Wine Promotions PTY LTD: Campbelltown, Australia, 2004.

(4) Buechsenstein, J. W.; Ough, C. S. SO2 Determination by Aeration-Oxidation: A Comparison with Ripper. 1978, 29 (3), 4.

(5) Anderson, G. Free & Total Sulfur Dioxide Measurement. 9.

(6) Vinmetrica SC-100A User Manual Version 3.1c. Vinmetrica.

(7) Megazyme Free Sulfite Assay Procedure Manual. Megazyme 2017.

(8) Luque de Castro, M. D.; González-Rodríguez, J.; Pérez-Juan, P. Analytical Methods in Wineries: Is It Time to Change? Food Reviews International 2005, 21 (2), 231–265. 

(9) Monro, T. M.; Moore, R. L.; Nguyen, M.-C.; Ebendorff-Heidepriem, H.; Skouroumounis, G. K.; Elsey, G. M.; Taylor, D. K. Sensing Free Sulfur Dioxide in Wine. Sensors 2012, 12 (8), 10759–10773. 

(10) Coelho, J. M.; Howe, P. A.; Sacks, G. L. A Headspace Gas Detection Tube Method to Measure SO2 in Wine without Disrupting SO2 Equilibria. American Journal of Enology and Viticulture 2015, 66 (3), 257–265. 

(11) Jenkins, T. W.; Howe, P. A.; Sacks, G. L.; Waterhouse, A. L. Determination of Molecular and “Truly” Free Sulfur Dioxide in Wine: A Comparison of Headspace and Conventional Methods. Am J Enol Vitic. 2020, 71 (3), 222–230.

Accuracy and precision of free SO2 testing methods

Joy Ting

January 2022

The most common question asked about SO2 methodology is some variation of “which is the best one” or “which one should I be using”? In a perfect world, we all want a method that is accurate, precise, robust, and inexpensive. However, the real answer depends on how much SO2 testing you are doing, how much time and resources you have to devote to the pursuit, and how accurate you need the results to be to make a good decision. Whichever method you choose to implement in your winery, you should always validate the method both at the beginning of use and periodically throughout its usage to ensure you have set things up correctly and nothing has changed after implementation. Even slight modifications to the way a method is applied in a winery can lead to significant changes in outcomes1.

Which method is the most precise?

As winemakers we are most concerned with the accuracy (the difference between the measured value and the true value) and precision (how well our methodology will produce the same result when performed multiple times)1 of a testing method. For free SO2 analysis, it is difficult to determine accuracy because many variables in the wine matrix affect how much SO2 is bound vs. free, making it very difficult to prepare standards. Instead, comparison to a mean is often used as a benchmark. But beware, if systematic errors exist, like poorly calibrated equipment or inherent biases in the test, the mean can be far from accurate (see the next section on headspace detection methods for molecular SO2 for a good example). Precision is easier to determine. One often-used measure of precision is the confidence interval (CV), which indicates the range within which the true value of the analysis is thought to fall given the imprecision in repeated testing. CV is calculated by dividing the standard deviation of a group of readings by the mean of that same group2. Each of the testing strategies outlined in the previous section (Ripper, aeration oxidation, spectrophotometric) have, to one degree or another, have been developed with the goals of accuracy and precision in mind. However, when tested in research laboratories and in wineries, determination of free SO2 has been shown to have some challenges.

There are a few reports of side by side testing of free SO2 testing methods. Buechsenstein and Ough (1978)3compared Ripper and aeration oxidation values for four wines (two reds, two whites) that had been spiked with 50 mg/L, 100 mg/L and 150 mg/L SO2. They report higher variation in Ripper (CV of 9.5%) than aeration oxidation (CV of 2.6%). In one Pinot Noir, the range of values found for AO was 61.8 – 64.5 mg/L while the range for Ripper was 51.2 – 60.8 mg/L. In an internal Unitech study of their spectrophotometric method, Geoff Anderson (n.d) tested 13 Chardonnays and 12 red wines and found Ripper accuracy to be +/- 5ppm while aeration oxidation accuracy was +/- 2ppm with AO results typically 7ppm lower than Ripper4. All spectrophotometric analyses yielded values within 7ppm of traditional values with differences depending on the wine and method. All Chardonnay samples were with 1.5 ppm of Ripper while spectrophotometric methods averaged 5-7 ppm higher in red wines. It is important to note these tests were done on an automated spectrophotometer, minimizing human error in pipetting. It is expected these rates would be higher using the same kits on a manual spectrophotometer.

Results of precision testing from research laboratories may differ from the precision reached in production wineries due to differences in quality control protocols. In 1988, the ASEV Technical Projects Committee undertook an effort to encourage implementation of quality standards in the American wine laboratory testing through proficiency testing1 that eventually grew into a program run through the Collaborative Testing Services (CTS)5(https://collaborative-testing.com). Participating wineries received two bottled sample wines every 4 months to analyze in-house with as many replications as they chose. Resulting values were reported to the testing agency and compared within and between labs. Participants fell into three categories: formally accredited labs with quality control systems in place, laboratories with few quality control systems in place, and those with neither training, experience, nor knowledge of laboratory quality systems. For free SO2, accuracy is difficult to measure because the amount of free vs. bound SO2 is often changing,  so results were compared to the grand mean of all reported results1,5,6. In a review of progress from 2002, Butzke (2002) reported variation in free SO2 values ranging from 11.8 – 29.4% depending on the wine tested, which could mean ranges as narrow as 16.6 – 23.2 but as wide as 11.8 – 22.1 mg/L (Table 1). In a report on 13 years of collaborative data from this program, including participation from 30-77 participants per cycle, free SO2 testing in general was shown to have a within-lab variation (CV) of 5.4% but across lab variation of 19.4%. These data included all methodologies, with 44% of participants reporting using aeration oxidation, 27% reporting using Ripper, and 6.4% reporting a colormetric method (the remainder were using segmented flow, flow injection, and enzymatic methods). In general, Ripper values were 2.7 mg/L higher than those reported from aeration oxidation methods (likely due to binding of non-SO2 components of the wine matrix). At the outset of this program, Butzke and Ebeler (1998) set a goal of 1% CV for each test. At each reporting, variation for free SO2 values was considerably higher5,6, and additional measures of quality control were suggested. 

How to validate a method and test proficiency in your winery

No matter which method you choose, it is important to understand the limitations of the approach and validate that method when it is first implemented as well as periodically check back to ensure it is being performed properly. The process of validation will allow you to identify and rectify sources of error as well as better understand how to interpret the values you generate. Unfortunately, many of the usual methods of validation are not applicable to free SO2 testing. Standard solutions are difficult to make and degrade quickly, and spiking a wine with a known amount of SO2 will not result in a commensurate increase in free SO2, as some (unknown) portion will be bound up1,2. Following are some approaches to determine if the free SO2determination method you choose is being performed properly:

  1. SO2 standard solutions can be carefully prepared from potassium metabisulfite2. Iland et al (2004) recommend preparing a stock solution of 10 g/L SO2 (using 75 g of reagent grade potassium metabisulfite dissolved in NaOH and diluted in water). The stock solution can then be diluted to working solutions of 20 mg/L, 50 mg/L and 100 mg/L. Testing replicates of 20 mg/L solution should recover no more than 10% variation (with results from 18-22 mg/L). Testing of each will produce a standardization curve, which should be linear.
  2. Analyze a number of samples in tandem with a trusted service lab1. Send topped, sealed bottles in glass (plastic allows oxygen to permeate which may change free SO2 values) to a trusted service lab, then run the same samples in-house on the day the lab receives them. Do at least three, and up to seven. From the results, you can calculate your accuracy relative to the service lab.
  3. To determine precision, run the same sample seven times2. Calculate the mean and standard deviation (Excel has a function for this). Divide the standard deviation by the mean to determine the %CV. A value of 10% or less is generally acceptable for winery decision making2. (For a value of 20 mg/L, this would equal a range of 18-22 mg/L.) Keep in mind precision depends on the type of wine, so repeat this procedure with red, white, and sweet wines.
  4. Repeat #2 on a different day to get an idea of how robust your method is to routine differences. If multiple people run free SO2 in your winery, test proficiency in each to identify differences and potential errors.

If the resulting values are unacceptably imprecise or not close enough to the service lab values, there are several questions to ask. First, are your values always higher or always lower? This could point to a systematic error, such as improperly calibrated equipment (for example, the flow rate on the AO is too high or too low) or poorly standardized solutions (0.01 M NaOH is really 0.0093 M), as well as consistent errors in endpoint determination (over-titrating will lead to consistently higher numbers). If variation is too high, perhaps more practice is needed with pipetting or titrating. 

Table 1: freeSO2 values reported from ASEV Laboratory Proficiency Testing from 1998-2001 (reproduced from Butzke 2002)


References

(1) Butzke, C. E.; Ebeler, S. E. Survey of Analytical Methods and Winery Laboratory Proficiency. American Journal of Enology and Viticulture 1999, 50 (4), 461–465.

(2) Iland, P.; Bruer, N.; Edwards, G.; Weeks, S.; Wilkes, E. Chemical Analysis of Grapes and Wine; Patrick Iland Wine Promotions PTY LTD: Campbelltown, Australia, 2004.

(3) Buechsenstein, J. W.; Ough, C. S. SO2 Determination by Aeration-Oxidation: A Comparison with Ripper. 1978, 29 (3), 4.

(4) Anderson, G. Free & Total Sulfur Dioxide Measurement. 9.

(5) Howe, P. A.; Ebeler, S. E.; Sacks, G. L. Review of Thirteen Years of CTS Winery Laboratory Collaborative Data. American Journal of Enology and Viticulture 2015, 66 (3), 321–339. 

(6) Butzke, C. E. 2000/2001 Survey of Winery Laboratory Proficiency. 2002, 7.

Warning: most methods are probably greatly overestimating free SO2 in reds wines!

Joy Ting

January 2022

Recent development of protocols for free SO2 determination using gas detection tubes has highlighted significant problems with the accuracy of traditional methods. The acidulation of wine in both Ripper and AO testing releases SO2 that is bound to anthocyanins and measures it as free. This information was reported as early at 1975 by Bourroughs1, however, corrective steps required several spectrophotometric measurements using solutions not commonly found in wine labs, and therefore, corrections are almost never made. Unfortunately, the amount of overestimation is significant (up to 66%) but depends on the concentration of each form of anthocyanins in the wine, so cannot be directly correlated to values routinely measured in the winery lab.

Experiments with gas detection tubes began with the goal of measuring free SO2 without interference from the wine matrix (as if found in Ripper) but also without complex and expensive glassware (as is the case with AO). Pegram et al (2013)2 developed a method using gas detection tubes to register sulfur in the gas phase. To move SO2 from the wine to the tube, wine was acidulated to convert SO2 into the gas phase, then alka-seltzer tablets were used to create a current that delivered SO2 to the tubes. However, the alka-seltzer tabs also buffered the acidulated solution, leading to a limit in the range of the test. To solve this problem, Coelho et al (2015) retained the use of the gas detection tubes but, instead of acidulation and airflow, they loaded wine into a closed syringe with known headspace, allowed molecular SO2 in the wine to equilibrate in the headspace, then depressed the plunger to move headspace air through the syringe3. This methodology measures molecular (gaseous) SO2 directly, from which free SO2 can be calculated. 

The headspace gas detection tube method correlated well with AO measurements for white and Rosé wines (R2 = 0.97) but the correlation with red wines was poor (R2 = 0.72), with headspace methods 2-3 times lower than those reported with AO. After investigating sources of systemic error, the researchers found that in traditional methods the acidulation of wine led to release of SO2 from anthocyanins while in the HS-GDT method this SO2 remained bound. They confirmed this was the cause of the difference in free SO2 values by measuring anthocyanins directly, calculating SO2 binding to various forms of anthocyanins present at that pH, then correlating back to the difference in free SO2 between AO and HS-GST. They found a very strong correlation (R2 = 0.94)3. Other non-perturbing methods also show this decrease in free SO2 measures.

Further investigation by Howe et al (2018)4 has shown that anthocyanin-bisulfite complexes do not appear to have any antimicrobial properties4. This group used sweet wines inoculated with EC1118 yeast to determine effective antimicrobial levels of SO2 using both AO and HS-GDT methods. They tested both white wine and white wine with added anthocyanin (to mimic red wine, but still compare to the white). In white wines, molecular SO2 values needed to prevent EC1118 growth were similar using either SO2 determination method, indicating no change is needed in our practice. In the pseudo-red wine however, a 2-log reduction was found with molecular SO2 of 0.5-2.0 mg/L when measured by HS-GDT while values greater than 2.0 mg/L when measured by AO were still not sufficient to affect cell counts. (In this study, HS-GDT measures of molecular SO2 were only 37% those found for AO3.) This means that if SO2 additions are made based on AO test results in red wines, it is unlikely molecular targets are being met and wine is left susceptible to microbial spoilage.

Unfortunately there is not an easy answer to this problem. The HS-GDT methodology is still very new and has yet to be optimized for the commercial winery. The gas detection tubes used in this method were manufactured for the mining industry, not for wine, and only one of three brands tested by the initial researchers worked2,3, and even these were discolored by the ethanol found in wine. Several sources of error have been identified, including the timing of syringe depression and leaks in the tubing attachments5. The manufacturer’s markings must be converted to linear scale, and calculations must be done based on temperature, pH and ethanol to determine free SO26. To aid in these calculations, researchers at Cornell have developed a downloadable Excel file (HSGDT calculator). Variation in readings is still large enough for the developers to recommend 5 replicate readings per wine, with each tube costing $7.50 and accommodating 2-3 readings each5. So far, this method is not automated, though work done by Jenkins et al (2020)7 converts the concept of headspace SO2 detection to an automatable form. If you would like to try this method in your own winery, Dlubac and Sacks (n.d.)5 provide sourcing information and step by step instructions for setup. Make sure you validate the method (by comparing values with white wines) with a known reliable reference method to ensure you are getting reliable numbers.


References

(1) Burroughs, L. F. DETERMINING FREE SULFUR DIOXIDE IN RED WINE. Am. J. Enol. Viticult. 1975, 26 (1), 5.

(2) Pegram, Z.; Kwasniewski, M. T.; Sacks, G. L. Simplified Method for Free SO 2 Measurement Using Gas Detection Tubes. Am. J. Enol. Vitic. 2013, 64 (3), 405–410.  

(3) Coelho, J. M.; Howe, P. A.; Sacks, G. L. A Headspace Gas Detection Tube Method to Measure SO2 in Wine without Disrupting SO2 Equilibria. American Journal of Enology and Viticulture 2015, 66 (3), 257–265.  .

(4) Howe, P. A.; Worobo, R.; Sacks, G. L. Conventional Measurements of Sulfur Dioxide (SO2) in Red Wine Overestimate SO2 Antimicrobial Activity. Am J Enol Vitic. 2018, 69 (3), 210–220.  

(5) Dlubac, G.; Sacks, G. L. Measuring Sulfur Dioxide (SO2) in Wine Using a Headspace Gas Detection Tube Method.

(6) Sacks, G. L.; Howe, P. A. “Free” Doesn’t Always Mean Free: Rethinking SO2 Measurements in the Winery. 6.

(7) Jenkins, T. W.; Howe, P. A.; Sacks, G. L.; Waterhouse, A. L. Determination of Molecular and “Truly” Free Sulfur Dioxide in Wine: A Comparison of Headspace and Conventional Methods. Am J Enol Vitic. 2020, 71 (3), 222–230. 

Virtual Sensory Session: SO2 Measurement and Management

Phil Fassieux, AJ Greely, Rachel Stinson Vrooman and Kirsty Harmon

April 2021

Winemakers from around Virginia gathered (virtually) to discuss results of two experiments. In the first, precision and accuracy of two commonly used SO2 detection techniques (aeration oxidation and the Hanna titrator) were tested and compared by Phil Fassieu (Whitehall Vineyards), AJ Greely (Hark Vineyards) and Rachel Stinson Vrooman (Stinson Vineyards). In the second, Kirsty Harmon (Blenheim Vineyards) compared the chemical, microbiological, and sensory effects of different SO2 addition rates after completion of fermentation in Chardonnay.

Watch Video Here

Contact

Sign up for our Mailing List