Protein Stability Testing Procedures

Joy

January 2021

Protein Stability Testing and Bentonite Fining Trials Comparing a 30 minute vs. 120 minute heat stability test Comparison of different test methods Recommended Protocol for Heat Stability Testing

In the course of research for the protein stability and bentonite testing trials, several questions came up regarding the type of stability testing being done, including the method used to achieve stability as well as several other aspects of the procedure. Following is a brief review of these issues, two short in-house tests of the tests, and a summary protocol that incorporates what we have learned about these tests. If you do in-house testing, or are thinking about starting this protocol in your winery, hopefully this will be a good resource for you. As always, feel free to reach out at any time with questions or comments (VaWrex@gmail.com).

Protein Stability Testing and Bentonite Fining Trials

Joy Ting

January 2020


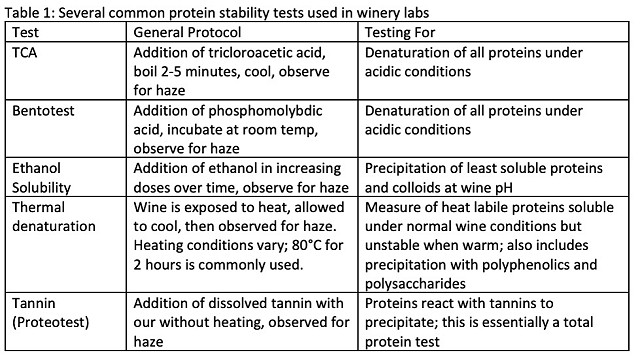
There is not a good formula to predict how much bentonite is needed to achieve protein stability(1). Instead, winemakers use protein stability testing coupled with bentonite fining trials to determine the rate of bentonite addition. Because protein instability is usually caused by forces acting over time, the true effect is difficult to mimic in a rapid test. Several testing procedures have been utilized to assess protein stability (Table 1), however none of these directly measures the effect that would occur in the bottle. The question then becomes, which test best estimates the amount of bentonite needed to achieve stability without over fining the wine?

One concern with protein stability testing is whether we are testing the same thing that happens in the bottle. In a study comparing methods of estimating protein stability, Esteruelas et al (2009)(2) chemically analyzed the protein precipitates that naturally occurred in Sauvignon Blanc and compared these to forced precipitates formed by different protein stability tests. 

  • All of the forced precipitates were different in composition from the natural precipitates. 
  • The slow heat test (60°C for 4 days) did not precipitate thaumin-like proteins, which are known to be involved in protein haze, while the ethanol test precipitated large amount of polysaccharides not found in the natural precipitates.
  •  The precipitate from the fast heat test (90°C for 1 hour followed by 4°C for 6 hours) was the most similar to the natural precipitate in terms of chemical composition2. 

In all cases, the tests produced more precipitate than natural precipitation, 3-11 times more! When bentonite fining trials were done, the tests estimated that bentonite levels between 50-80 g/hL were needed for stability. The fast heat test and slow heat test both estimated stability with 60 g/hL, the average of the range of tests, and the tannin test agreed with the heat test for this wine. 

Another way to look at this question is to test how good each procedure is at predicting actual instability. The Australian Wine Research Institute (AWRI) did a series of studies on this question (reviewed by Pocock et al) (3). In the first trial they compared the predicted bentonite fining rates from two versions of the heat test (heating to 80°C for six hours and two hours), as well as the Bentotest under three storage conditions: 

  • 35°C for four weeks
  • fluctuating daily from 20°C to 35°C for eight days
  • “idealized” conditions at <20°C for three years. 

Eight wines were tested by fining at several rates around the predicted rate, then storing the wine at each condition. All of the tests predicted bentonite rates that were sufficient to achieve stability under short-term severe conditions, however this often resulted in over fining (adding more bentonite than needed). For example, in all eight cases, the Bentotest predicted a fining rate above the lowest rate that needed to have a wine that was still bright after storage. The heat tests did better, over fining less often and by much lower amounts (3). 

When compared, higher rates of bentonite were needed to achieve stability for long term storage than for short-term severe storage conditions. After three years of storage, three of the eight wines were under fined at the rate predicted by the heat test, meaning they had visible haze at the predicted bentonite rate. However, in a separate comparison of four wines fined to stability based on the two heat tests, Prostab and Proteotest, severe storage conditions required higher bentonite rates than ideal storage for 6 months and all of the tests predicted rates that over fined the wines. When considered together, these tests show that the accuracy of any given test will be different depending on what is causing the instability of the wine, as well as the intended storage conditions. 

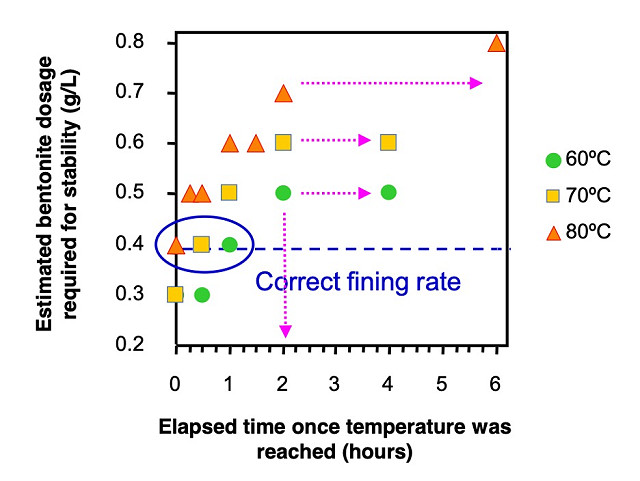
Figure 1: Effect of time and temperature of heat stability testing on estimated bentonite dosage, from Wilkes (n.d.)(4)”

The most commonly used protein stability test is the fast heat test, however the temperature, time, and cooling procedures used with this test vary widely. In the AWRI literature, a heat test of 80°C for 6 hours has become the standard. Pocock et al (2018)(3) explains that this standard originated from a previous study testing heating times of 0-6 hours. Results showed that an the estimated fining rate needed for stability increased from 0.4 to 0.7 with increased incubation time for the first two hours. A fining rate of 0.8, the most stringent result, was estimated at 6 hours (Figure 1 from Wilkes , n.d). However, as shown above, heating for this long often overestimated the fining rate needed in storage tests. Estimation of fining rates at lower temperature were also lower (4), however, as shown by Estuelas et al (2009), the slow heat test (lower heat) did not precipitate thaumin-like proteins, known contributors to protein haze (2). The same AWRI study also looked at cooling times, showing that wines cooled for 2 hours would have passed (∆NTU<2.0) while the same wine cooled for 17 hours would not have passed, indicating haze formation depends on cooling time as well as heating time (4). Therefore, the most stringent result can be found at 80°C for 6 hours but this is likely to overestimate the amount of bentonite needed.

Another area of interest when discussing protein stability testing is the accuracy of the protocol itself.  In any lab testing situation, the test itself has inherent errors as well as common human errors that alter the accuracy of results. Several sources of error have been identified in laboratory-scale protein heat tests. To combat these, AWRI recommends the following:

  • Make sure a representative sample of the wine is being tested. This includes taking a composite sample of all of the barrels in a given lot.
  • Filter samples prior to testing. If your wine will be filtered (through 0.45 um filter) before bottling, protective colloids may be removed and lead to instability. This also ensures all bentonite has been removed prior to heating. They suggest NTU<1.0 at the beginning of the test. A higher NTU indicates an inadequate filtration.
  • The water bath must maintain the target temperature for the allotted time. The water temperature will drop with the addition of a large number of samples into a smaller bath. Start timing the incubation after the temperature has returned to the target.
  • Make sure no water gets into the tubes from the water bath.
  • Cool the samples for at least 2 hours before reading the change in NTU. Some haze requires cooling to form.

In addition to the conditions of the heat test, the method of addition of bentonite during bench trials has been shown to have an effect on the outcome of the tests (5). Weiss et al (2001) investigated several aspects of laboratory bench trials on the predicted bentonite rate. They found no significant differences in outcomes based on pipetting of benchtop solutions, the age of the bentonite solution (one vs. thirty days), nor the rate of addition of bentonite solution (dropwise vs. steady stream). However, they found large differences based on the mixing speed of the addition, with fast mixing resulting in three times lower turbidity than slow mixing. They also found considerable variation between replicates, even with the same operator conducting the test. This affect was more pronounced at higher treatment levels (48 g/hL). They suggest running tests in triplicate to overcome this variation, which may not be practical in the winery setting. They found lower variation in unfined trials, so one alternative to replicates would be to re-test the wine after bentonite addition to ensure stability has been reached.

Lastly, it is imperative to conduct laboratory bench testing with conditions as similar as possible to those that will be used in the cellar. This includes using the same brand and lot number of bentonite, the same water for rehydration, and the same amount of time for hydration (4,6). The most difficult parameter to correlate is the mixing regime, however, based on the finding of Weiss et al (2001), differences can lead to very different outcomes. Another consideration is temperature. Bentonite is thought to bind protein very quickly, however, at colder temperatures, bentonite may settle faster and affect binding. Trials should be done at the same temperature as fining (6).

 In 2018, two sets of WRE experiments addressed elements of protein stability testing:

Comparison of Protein Stability Test Predictions and Bentonite Product Efficacy, Scott Dwyer, Chemeketa Cellars Students of Scott Dwyer at Chemeketa Community College in Salem, Oregon tested three bentonite products with two different protein stability testing procedures, an acid test (Bentotest) and a fast heat test (80°C for 6 hours). 

Comparing results of a 30 minute benchtop test with a 120 minute test, Emily Pelton, Veritas Vineyards and Winery  Emily Pelton and Jolie Thompson at Veritas Vineyard and Winery tested two different wines with a heat test at 30 minutes and 120 minutes as part of a larger trial of protein stability. 

Also, based on the research for this article as well as the other newsletters on protein stability testing, a protocol was prepared for use in the winery laboratory. If your current protocol is working well, by all means, stick with it. However, if you are looking to add protein stability testing to your lab repertoire, or you feel your current protocol needs improvement, this may be helpful. 

Recommended Protocol for Heat Stability Testing and Bentonite Trials, Winemakers Research Exchange 


 References

(1) Blateyron, L.; Meistermann, E.; Trottier, C. Stabilisation Proteique Des Vins Blancs et Rose: Etude Comparative Des Bentonites et Rechaerche d’une Approche Raisonnee Des Traitements. Congres OIV 2007.

(2) Esteruelas, M.; Poinsaut, P.; Sieczkowski, N.; Manteau, S.; Fort, M. F.; Canals, J. M.; Zamora, F. Comparison of Methods for Estimating Protein Stability in White Wines. American Journal of Enology and Viticulture 2009, 60 (3), 302–311.

(3) Pocock, K.; Waters, E.; Herderich, M.; Pretorius, I. Protein Stability Tests and Their Effectiveness in Predicting Protein Stability during Storage and Transport A W R I Report. Wine Industry Journal 2018, 23(2), 40–44.

(4) Wilkes, E. Testing Protein Stabilty, Feeling the HEAT.

(5) Weiss, K. C.; Lange, L. W.; Bisson, L. F. Small-Scale Fining Trials: Effect of Method of Addition on Efficiency of Bentonite Fining. Am J Enol Vitic. 2001, 52 (3), 275–279.

(6) Zoecklein, B.; Fugelsang, K. C.; Gump, B. H.; Nury, F. S. Wine Analysis and Production; Springer: New York, 1995.

Comparing results of a 30 minute benchtop test with a 120 minute test

Emily Pelton

Veritas Vineyard and Winery

The standard protein stability bench test at Veritas includes heating wine at 80°C for 2 hours, cooling, then reading the resulting difference in turbidity.  Other Virginia wineries run the same test for 30 minutes. For this study, Veritas ran the trial twice, once at each time interval using two wines:

  • Control: Sauvignon Blanc wine that received no bentonite during fermentation
  • Treatment: Sauvignon Blanc wine that received 40 g/hL during fermentation

Table 4: Comparison of 30 minute and 2-hour incubations for benchtop protein stability tests

If stability is determined as a ∆NTU<2.0, the estimated treatment of bentonite needed for stability is as follows:

  • 30 minute test, control wine: 75-100 g/hL
  • 30 minute test, treatment wine: very near 75 g/hL
  • 120 minute test, control wine: 75-100 g/hL
  • 120 minute test, treatment wine: 50 g/hL

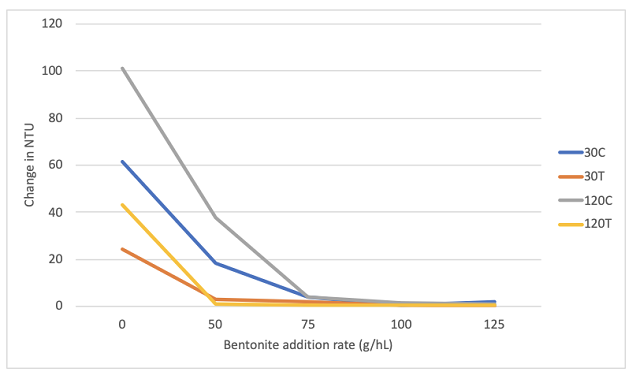
Figure 1: Change in NTU for Control and Treatment wines at two different incubation times


For the control wine, both tests predicted protein stability would be reached with a bentonite addition between 75-100 g/hL. The change in NTU is slightly higher for the 120 minute test, however this did not result in a change in predicted addition rate. 

For the treatment wine, the 30 minute test predicted stability at 75 g/hL while the 120 minute test predicted stability at 50 g/hL. The difference in NTU for both tests at 50 and 75 g/hL is very small. These tests were not run as replicates, so some of these differences may be due to the known error rate of the test1.

The different in turbidity between heating times decreased as bentonite addition rates increased and was very similar at rates achieving stability. This finding is consistent with the idea that once unstable proteins are removed, it no longer matters how long they are denatured, they will not produce haze.


References

(1) Weiss, K. C.; Lange, L. W.; Bisson, L. F. Small-Scale Fining Trials: Effect of Method of Addition on Efficiency of Bentonite Fining. Am J Enol Vitic. 2001, 52 (3), 275–279.


Comparing three bentonite products for efficacy, packing, and color stability (2018)

Scott Dwyer and Students

Chemeketa Community College

Summary

Under the direction of Scott Dwyer, students at Chemeketa Community College undertook a series of experiments exploring the properties of different bentonite products. Testing showed that the rates of bentonite predicted to achieve protein stability differed depending on which bench test was used (Bentotest vs. fast heat test) and which bentonite was used. Lees compaction of bentonite was both bentonite-dependent and wine-dependent. Bentonite fining of Rosé wine led to decrease in color intensity and increased hue. This effect was more pronounced in a Rosé with higher initial color intensity.

Introduction

There are many different bentonite products available on the US market with differences in origin, chemistry, and processing that lead to differences in performance. Under the direction of Scott Dwyer, students at Chemeketa Community College in Salem, Oregon undertook a series of experiments to explore several bentonite products for efficacy and efficiency in a lab setting. Three bentonite products were chosen for study:

Microcol Alpha (Laffort) (MA) is a sodium bentonite with moderate compaction. Product information claims “aromatic preservation” and “color preservation”. MA is rehydrated in 10 times its weight in hot water for 12-24 hours.

Vitaben (Gusmer) (VB) claims to produce reduced lees, have higher activity, and easier handling than other bentonites. Product information does not specify if it is sodium or calcium based. It is rehydrated in cold water. Rehydration time is not listed.

KWK Kwik (KWK) is a sodium bentonite. Product information claims it removes proteins but not tannins. This product requires rehydration in hot water. Rehydration time is not specified in product information; 12 hours is generally recommended.

Several questions were explored:

  1. Comparison of Protein Stability Test Predictions and Bentonite Product Efficacy
  2. Comparison of compaction rate of three bentonites in six wines
  3. Change in Rose color with fining

Comparison of Protein Stability Test Predictions and Bentonite Product Efficacy


Introduction

Several tests can be utilized for protein stability. These tests differ by the basis of protein precipitation, usually relying on either heat or acid to hasten instability. In this study, two testing methods were used to predict the rate of bentonite needed for stability: the Bentotest (an acid-based test) and the fast heat test.

The Bentotest is a commercially available preparation of phosphomolybdic acid. The test is performed by adding 1 part reagent to 10 parts wine at room temperature, creating a very low pH environment. The solution is then allowed to incubate a short time (3-5 minutes). This rapid test is a measure of protein precipitation under acidic conditions and requires no heating.

The fast heat test subjects the wine to high heat (80°C) for a short time (30 minutes to 6 hours) to denature proteins. Turbidity is measured before heating and after wine is allowed to cool as an indication of unstable proteins. This technique requires more time, but has been shown to produce precipitates closer to the type formed during wine aging than other tests1.

Methods

Prior to heat or acid tests, wines were treated with stock solutions of bentonite to a final concentration of 0, 25, 50, 75, 125, and 200 g/hL. Bentonite was allowed to settle then wine was decanted off bentonite but not filtered. Each wine/bentonite pair was treated with each concentration of bentonite.

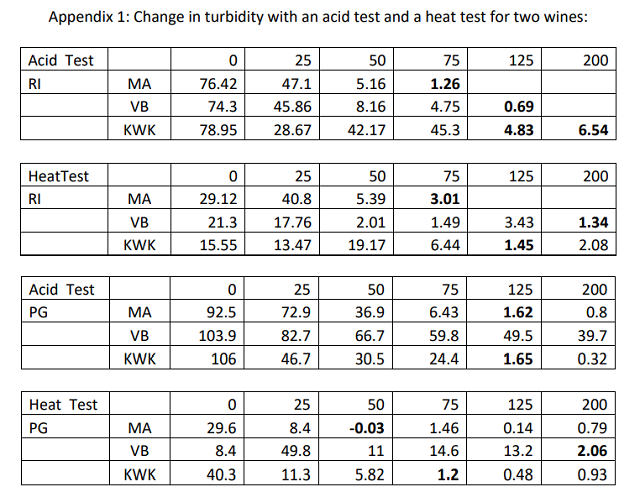
For the acid test, 1 mL of Bentocheck reagent was added to 10 mL of bentonite-fined wine. Tubes were mixed by inversion and incubated 1 minute prior to checking turbidity. For the heat test, wine was heated for 6 hours at 80°C and allowed to cool before measuring final NTU. Turbidity measurements before and after treatment with acid (Bentotest) or heat were recorded. A change in turbidity <2.0 NTU was considered stable. In this trial, wines were not filtered prior to heating or treatment with Bentotest reagent. 

Results

Two wines, a Riesling and a Pinot Gris, were fined with six doses of bentonite and tested for protein stability using a Bentotest and a fast heat test (Table 1, Appendix A). Each wine was tested with three different bentonite products. The acid test predicted a higher rate of bentonite addition in four of the six tests while the heat test predicted a higher rate in two of six tests. There was not agreement between tests for any of the six wine/bentonite pairs. At times these differences differed in predicting stability within 25 g/hL of bentonite, but differences as large as 100 g/hL were seen. 

When comparing efficacy of bentonite products, Microcol Alpha achieved stability at the lowest rate in both wines while Vitabin required the highest rate for both wines.


Comparison of compaction rate of three bentonites in six wines

Introduction

A major concern with bentonite is volume loss. Waters et al (2005) cites an estimate that the worldwide cost of bentonite fining of wine per year is on the order of $300-500 million2 while Robinson et al (2012) cites a figure of $1 billion3. These costs are largely due to wine lost during racking off bentonite lees. If 5-10% of the volume is lost at this step4, these costs add up quickly.

Methods

In this study, 6 wines were treated with five concentrations of three different bentonite stock solutions and allowed to settle. After settling, the height of the bentonite column in the container was measured.

Results
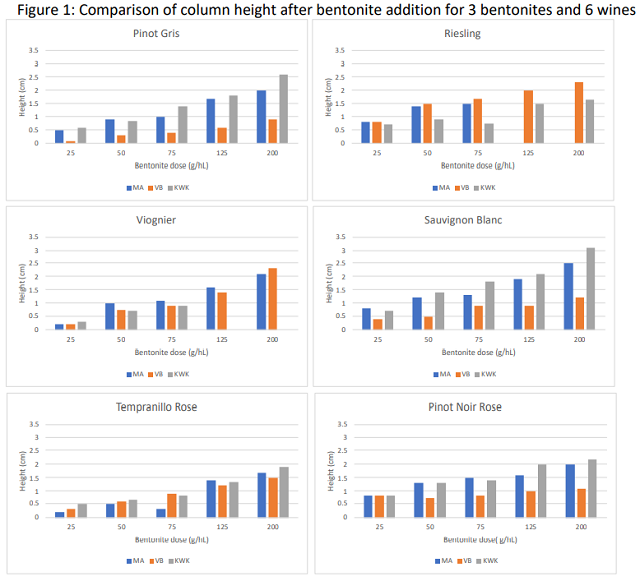
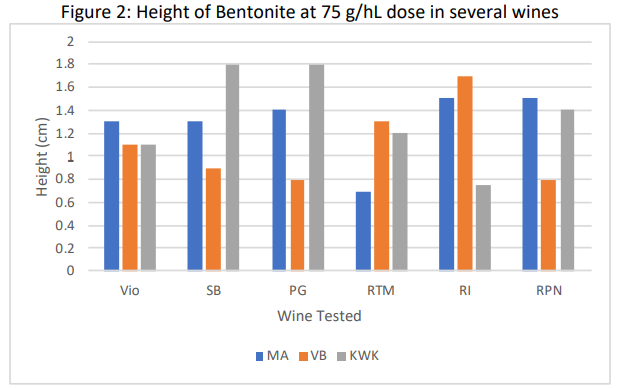
Relative compaction among bentonite products varied considerably depending on the wine (Figure 1, 2). For example, Vitaben showed very good compaction in Pinot Gris, with the shortest column at all doses, but much less compaction in Riesling), with the highest column of the products tested.

Also, the height of the column at a given rate differed by wine for each product.  For example, at 75 g/hL each bentonite product had very different column height depending on the wine (Figure 2).  Though bentonite settling is affected by the properties of the bentonite itself (sodium vs. calcium), it is also affected by the wine matrix. There is differential packing of bentonite sheets in different chemical matrices of wine5.


Comparing bentonite products for color stripping in Rosé


Introduction

Bentonite fining for protein stability is based on charge. Bentonite is negatively charged when hydrated. Proteins are mostly positively charged at wine pH. In its simplest form, bentonite fining is the attraction of positively charged proteins to negatively charged bentonite, that then settles out of the wine.

Unfortunately, there are other components of wine that are also positively charged, including anthocyanins. Red wines are rarely treated with bentonite because the tannins in the wine have already bound most of the protein. Also, red wines are generally opaque so protein precipitate will not be as noticeable. However, this is not the case with Rosé. Rosé has many fewer tannins and is often presented in clear bottles to showcase the color. Therefore, color stripping during bentonite fining is a concern in Rosé wine.

Methods

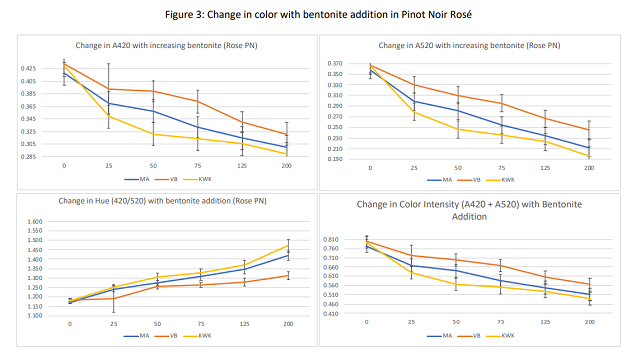
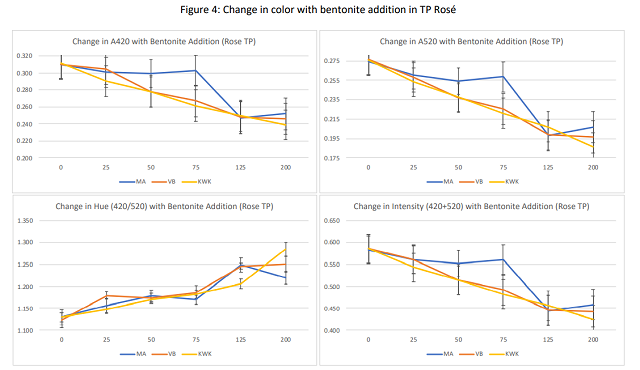
In this study, three bentonite products were used to fine two Rosé wines at five different rates. Absorbance at 420 nm and 520 nm was read for each wine after fining. Absorbance at 420 nm is a measure of the amount of yellow and brown color in wine while 520 nm measures the amount of red color (a proxy for anthocyanins) in the wine. The hue is calculated as the ratio of absorbance at 420/520. A higher number indicates a more yellowish color while a lower number indicates a shift to the red part of the spectrum. Color intensity is simply the sum of A420 + A520.

Each test was done in triplicate. Values reported are the average of three tests. Error bars represent the standard deviation from the mean.

Results

In the Pinot Noir Rosé, all three bentonite products showed a decrease in A420, A520, and color intensity, as well as an increase in hue (Figure 3). These trends are consistent with stripping of anthocyanins. When comparing products in all measures of color loss, the same trend appears in each case: KWK>MA>VB. This trend was also seen in the opposite direction with the shift in hue from red to yellow.

However, this same trend was not seen in TP Rosé (Figure 4). There was less separation among products overall, and in general, KWK and Vitaben appeared to strip more color than MA. TP Rosé began with less color overall, so it is possible that at lower pigment levels, color stripping is less prevalent.

Conclusions

  • Heat test and acid tests produced different predictions for the amount of bentonite needed to achieve stability for all bentonites in the two wines tests. Neither test was consistently more stringent than the other, and tests sometimes differed by large amounts (up to 100 g/hL of bentonite).
  • In the two wines tested, Microcol Alpha appeared to have the best binding efficiency, with the lowest predicted rate of addition needed to achieve stability.
  • Bentonite compaction rate varied considerably by wine. No single bentonite product showed consistently better packing at the same rate in each of the six wines tested.
  • Bentonite addition led to color stripping in Rosé. KWK and Microcol alpha stripped more color in one of the two wines tested. There was not as clear of a difference in the second wine tested.
References

(1)    Esteruelas, M.; Poinsaut, P.; Sieczkowski, N.; Manteau, S.; Fort, M. F.; Canals, J. M.; Zamora, F. Comparison of Methods for Estimating Protein Stability in White Wines. American Journal of Enology and Viticulture 2009, 60 (3), 302–311.

(2)    Waters, E. J.; Muhlack, R. A.; Pocock, K. F.; Colby, C.; O’Neill, B. K.; Jones, P. Preventing Protein Haze in Bottled White Wine. Australian Journal of Grape and Wine Research 2005, No. 11, 215–225.

(3)    Robinson, E.; Scrimgeour, N.; Marangon, M.; Muhlack, R.; Smith, P.; Godden, P.; Johnson, D. Beyond Bentonite. Wine and Viticulture Journal 2012, No. November/December, 24–30.

(4)    Blateyron, L.; Meistermann, E.; Trottier, C. Stabilisation Proteique Des Vins Blancs et Rose: Etude Comparative Des Bentonites et Rechaerche d’une Approche Raisonnee Des Traitements. Congres OIV 2007.

(5)    Dordoni, R.; Colangelo, D.; Giribaldi, M.; Giuffrida, M. G.; De Faveri, D. M.; Lambri, M. Effect of Bentonite Characteristics on Wine Proteins, Polyphenols, and Metals under Conditions of Different PH. American Journal of Enology and Viticulture 2015, 66 (4), 518–530. https://doi.org/10.5344/ajev.2015.15009.

(6)    Zoecklein, B. Bentonite Fining of Juice and Wine. Enology Notes Online Publications 1988.

Download Report

Recommended Protocol for Heat Stability Testing and Bentonite Trials

Winemakers Research Exchange

December 2019

This protocol for a fast heat test measures the change in turbidity after heating as an indicator of protein stability. Bentonite trials are run concurrently with a non-treated control to determine the dose of bentonite needed to achieve protein stability. 

Make a 5% stock solution of pre-hydrated bentonite

The bentonite used for the trial should be from the same manufacturer, brand, and batch as the bentonite that will be used in the wine. Make up a new stock solution in the event a new bag of bentonite is opened.

  1. To make a 5% Bentonite stock solution(50g/L)(1:20 dilution), weigh out the mass of bentonite you will need. For 1 L of stock solution, you will need 50 g of bentonite.
  2. Measure 80% of the volume of water needed into a beaker with a stir bar. If you are making 1L of stock, you will need 800 mL or water, here.  Use the same water as will be used in the winery to rehydrate bentonite for addition to wine. Adjust the stir plate to a moderate speed and slowly add the bentonite to avoid clumping.
  3. If a stir plate is not available, bentonite can be mixed in a close-topped container by inverting the container several times. It may take time to suspend all of the bentonite. Check carefully for any clumps that may remain. 
  4. Heat can be used to encourage the bentonite to dissolve. Some bentonite products require heat. Follow the manufacturer’s recommendation for water temperature.
  5. Once the bentonite is fully dissolved, pour the solution into a graduated cylinder or volumetric flask.  Add winery water until the target volume is reached (1 Liter). 
  6. Transfer the stock solution to a container with an airtight lid and store it in the refrigerator. To aid in resuspension before use, store with a stir bar in the container.

Heat Stability Test/Bentonite trial

  1. Resuspend the 5% stock solution of bentonite by placing the storage container on a stir plate. If the bentonite has settled to prevent the stir bar from moving, gently shake or stir the solution manually. Once the stir bar can move, allow it to mix while you prepare the wine. The bentonite stock solution must be fully mixed prior to addition to wine for bench trials.
  2. Determine the amount of 5% stock solution you will need to add to 100mL of wine.  A useful technique is to realize that 5% solution has 5 g/100 mL of solution. 
    • For example, if you plan to test 10 g/hL, 20 g/hL and 30 g/hL of bentonite in a volume of 100ml wine, you will need to add 200 uL, 400 uL and 600 uL of stock solution, respectively.
    • For wines that have a suspected high rate of instability (such as Sauvignon Blanc, Pinot Gris, Traminette and Petit Manseng), you may choose to first test a wide range (25, 50, 75, 100 g/hL), then do a second test within a smaller range to determine in the precise addition. For example, if stability is reached between 50 and 75 g/hL in the first trial, test 50, 60, 70 g/hL in the second trial.
  3. Measure 100mL of wine with a graduated cylinder into a small labeled bottle for each treatment plus control. (You will need 4 bottles total for the example given above.) Use a micropipette to add the well-mixed bentonite stock solution and mix. Mixing should mimic the rate of mixing that will occur in the tank. Practically, this is best determined by eye. If no stir plate is available, mixing can be done by inverting the closed bottle (ensure the closure is secure before inverting). Allow the bentonite to settle overnight after mixing. 
    • The volume of the sample can be adjusted if needed. Re-calculate the volumes of bentonite additions to accommodate a change in base wine volume. However, be aware of the final volume needed for the NTU meter. Allow for a 10% loss of volume during filtration to determine the minimum volume needed.
  4. After settling, turn on a water bath to 80°C. If a water bath is not available, an immersion circulator (available commercially for kitchen use) can be used. Make sure the temperature gauge is set to Celsius.
  5. Decant the wine off the settled bentonite into a separate container, then filter. A 0.45 um filter should be used to determine protein stability for wines that will be sterile filtered. Following are two possible methods for filtration:
    • If using a syringe filter, insert a 0.45 um filter into the filter housing and secure it. Pull up the wine into the syringe, then screw on the filter and gently depress the plunger. Go slowly, as the filter can burst.
    • If using a vacuum pump attached to a side arm flask, attach the Buchner funnel and place a 0.45um filter inside the funnel. Wet the membrane with distilled water and start the vacuum to clear the membrane. Discard the water in the flask. Re-wet the filter with a small amount of the wine sample, start the vacuum to rinse the filter. Discard this wine as well (it is still diluted with residual water from the rinsing). Then, filter the full wine sample. 
  6. Prior to heating, measure the NTU of each sample individually. Each NTU meter will be slightly different, so follow manufacturer’s instructions for use. 
    • Check the standards to make sure the meter is calibrated. (If the meter is not calibrated, follow the manufacturer’s instructions for calibration.)
    • Make sure the sample vials are clean prior to use. If needed, clean the vials with distilled water and a lint-free, scratch-free cloth. Avoid leaving fingerprints on the sides of the vial as this interferes with measurement.
    • Rinse the sample vial with a small amount of filtered wine and discard. Then, fill the sample chamber with filtered wine. Read and record the initial NTU for each sample. Return wine the wine to the sample bottle after reading the NTU.
    • The initial NTU of filtered wine should be less than 2.0. If the turbidity is higher than this, check the filter and filter again.
  7. Transfer samples to glass bottles or tubes that can be heated in the water bath. Take care to record the position of each sample in the bath, as markings on glass containers may be removed by hot water and steam.
  8. Incubate the samples in a warm water bath (80°C) for 30 minutes (or 120 minutes, if you prefer). Make sure the water level goes as far up as the sample in the bottle or tube but does not enter the tube. Use parafilm or tube covers if possible. It is likely the temperature of the bath will drop when the samples are put into the bath. Wait until the bath returns to 80°C before starting the timer.
  9. After 30 (or 120) minutes, remove tubes from the water bath and allow them to cool to room temperature. Tubes should be allowed to cool for 6 hours to overnight.
  10. After samples have cooled to room temperature, measure the turbidity again using the same procedure as above. Record the final turbidity.
    • Important! Make sure to resuspend any particulates that have settled to the bottom of the tube prior to reading NTU. These are proteins that have come out of solution that should be included in the turbidity number.
  11. Calculate the change in turbidity by subtracting the initial NTU from the final NTU. It is expected turbidity will rise as a result of heating. Generally, a change of less than 2.0 NTU is considered heat stable.
  12. To clean, rinse the vials several times with hot water, then several times with distilled water. Dry the vials thoroughly before putting them away.

Measuring for CMC stability

CMC products (like Celstab or Claristar) are commonly used to achieve tartrate stability without having to cold stabilize large tanks of wine. These products require that the wine be protein stable prior to treatment because their addition can trigger protein haze formation. (CMC is a carbohydrate that can complex with protein to cause haze.) Though CMC instability has been reported in rare cases to take as long as 48 hours (with a single reported case at 4 months)(Eglantine Chauffour, personal communication), most instability occurs immediately.  

If you plan to use a CMC-based product and want to first test to determine your wine is fully protein stable for this addition, the following protocol is recommended:

  1. Treat the wine with bentonite to the determined rate. Allow bentonite to settle.
  2. Take a sample of the bentonite-treated wine. Filter the wine through a 0.45 um filter.
  3. Measure initial NTU. This number should be less than 2.0.
  4. Add 1 ml/L CMC product.
  5. Perform the heat test as described above (80°C for 30-120 minutes).
  6. Measure the change in NTU from the initial test.
  7. A difference of less than 2.0 indicates stability.

References

The above protocol was adapted using information from the following sources

(1) Esteruelas, M.; Poinsaut, P.; Sieczkowski, N.; Manteau, S.; Fort, M. F.; Canals, J. M.; Zamora, F. Comparison of Methods for Estimating Protein Stability in White Wines. American Journal of Enology and Viticulture 2009, 60 (3), 302–311.

(2) Pocock, K.; Waters, E.; Herderich, M.; Pretorius, I. Protein Stability Tests and Their Effectiveness in Predicting Protein Stability during Storage and Transport A W R I Report. Wine Industry Journal 2018, 23 (2), 40–44.

(3) Weiss, K. C.; Bisson, L. F. Effect of Bentonite Treatment of Grape Juice on Yeast Fermentation. American Journal of Enology and Viticulture 2002, 53 (1), 28–36.

(4) Iland, P.; Bruer, N.; Edwards, G.; Weeks, S.; Wilkes, E. Chemical Analysis of Grapes and Wine; Patrick Iland Wine Promotions PTY LTD: Campbelltown, Australia, 2004.

Download Report

Contact

Sign up for our Mailing List