pH, TA, and acid adjustments

Beth Chang & Joy Ting

September 2020

Acids in Wine How to measure acidity in fruit and juice samples Strategies for Acid Adjustment

It is hard to believe it is September already, especially since many winemakers have just begun to process the first fruit of the season. If you are feeling impatient, you are not alone. It seems like the grapes are taking their time this year! The WRE has been working with the Virginia Tech Viticulture and Enology Extension team to track grape ripening across the state as part of their Sentinel Vineyard Project.

Through this effort, we have noticed that several grape samples have imbalances in acidity vs. sugar development. For this reason, Dr. Beth Chang and I put together a quick primer on pH, TA, and acid adjustments in wine. Our hope was to provide some quick reminders, needed protocols and some tips for acid adjustment as you consider the additions you may need to do to juice and wine this season. For more information or clarification, feel free to contact either one of us (Beth: eabc@vt.edu)(Joy: VaWREx@gmail.com).

Acids in Wine

Dr. Beth Chang

September 2020

pH is a major contributor to the following factors in wine: 1) microbial stability, and 2) color stability. Lower pH, preferably < 3.6, is important for decreasing risk of spoilage organisms and increasing efficacy of SO2. Likewise, a lower pH increases color stability, and keeps color molecules, i.e. anthocyanins, in the preferred color range of red-purple, rather than purple-brown. In addition, lower pH can increase rates of reactions for various wine components during storage(1,2).

When we measure pH, we are measuring the strength of the acid (or acids) in a solution, in this case: grape juice or wine. Because of the word “acid”, it is easy to assume that pH is useful in evaluating the acidity, or perception of sourness. And yes, pH does have a loose inverse correlation to sourness. However, a much more predictive metric is TA (titratable acidity), which relates to the concentration of acids in juice and wine. TA has a much stronger (nearly linear) and direct correlation to sourness: rising TA concentrations will result in increasingly sour taste (2,3).

Typically, there is an inverse relationship between pH and TA: lower pHs indicate higher TAs and vice versa. However, the two do not ever track in a perfectly predictable way, and there are times when both high pH and high TA can be present simultaneously in a juice or wine. The two major reasons for this are: 1) different organic acids (which are all weak acids) have different buffering capacities, or to put it another way, some organic acids, e.g. tartaric acid, are stronger weak acids than others. This means that their addition or removal will have a larger impact on pH. Therefore, the relative amounts of organic acids will lead to different pHs at the same TA. And 2) higher concentrations of metals (e.g. K+, Ca+2, Mg+2) in the grape juice and wine matrix can result in increased pHs at a given TA because the metals likewise increase buffering capacity, while masking the total number of acid molecules (i.e. total acidity) through hydrogen displacement.2This second cause is particularly pertinent in the mid-Atlantic region (e.g. Virginia), where excessive potassium absorption frequently occurs (4).

When looking at the pH and TA of a must or wine, it’s helpful to have some reference points against which to compare values. Generally accepted industry ranges for must pH would be 3.0 – 3.4 for whites, and 3.2 – 3.4 for reds (1). The resulting final wine product is broadly between pH 3 – 4, with whites on the lower side and reds on the higher side, e.g. 3.3 – 3.7 (2). Typical values for TA (measured as g tartaric / L) are between 5 – 8 g/L. Red wines tend to skew lower than whites because the potassium extracted from the grape skins will cause increased potassium bitartrate precipitation (1).

Measuring pH and TA is essential prior to fermentation, and can also be useful well before harvest to get a better picture of overall fruit quality. As grape berries mature, pH will increase and TA will decrease. Factors related to accelerated berry maturation, e.g. warm temperatures, will result in a faster rise in pH and rate of decline in TA (5).

If you are interested in learning more about “typical” pH, TA, and other fruit ripening metrics in Virginia, be sure to subscribe to VT Enology Extension’s mailing list so that you can receive Sentinel Vineyards reports. The Sentinel Vineyards initiative is a Virginia Wine Board sponsored collaboration between Virginia Tech’s Viticulture and Enology Extension team, the WRE, and a network of industry partners, to collect, analyze and disseminate data on the status of the grape growing and winemaking season. We hope that the information provided on relevant statewide viticultural, pathological, meteorological, and enological parameters will aid in your decision-making process. In addition, these evaluated metrics, e.g. disease incidents, weather conditions, fruit chemistry, provide longitudinal data for establishing a baseline tailored to Virginia’s climate.


References

(1) Boulton, R. B.; Singleton, V. L.; Bisson, L. F.; Kunkee, R. E. Principles and Practices of Winemaking; Springer US: Boston, MA, 1999. 

(2) Waterhouse, A. L.; Sacks, G. L.; Jeffery, D. W. Understanding Wine Chemistry; John Wiley & Sons, Ltd: Chichester, UK, 2016. 

(3) Plane, R. A.; Mattick, L. R.; Weirs, L. D. An acidity index for the taste of wines. American Journal of Enology and Viticulture 1980, 31 (3), 4.

(4) Wolf, T. K. Wine Grape Production Guide for Eastern North America; Plant and Life Sciences Publishing: Ithaca, New York, 2008.

(5) Dokoozlian, N. K.; Kliewer, W. M. Influence of Light on Grape Berry Growth and Composition Varies during Fruit Development. 6.

Measuring acidity in fruit and juice samples

Dr. Beth Chang and Dr. Joy Ting

In order to make good decisions about additions to juice and wine, you need to have a good measure of what you are starting with. Much of the information you need can be obtained in the winery lab with minimal equipment, time, and expense. 


pH

The most important measurement is the pH of the wine. To ensure you have an accurate measure of pH, you must have a good working pH meter that is properly calibrated. Once you get your pH meter up and running, you will also use it for acid trials and measurement. Though each pH meter is different, there are a few principles to keep in mind when calibrating and measuring pH of grape juice and wine. 

pH Protocol and Best Practices

Acid trials

There is a complex relationship between the concentration of acids in grape juice and wine and their effect on the pH of the solution. Grape juice and wine are buffered solutions, meaning there are a number of components in the juice that will resist changes in pH when acid is added (known as the buffering capacity)(6). The best way to determine how a juice or wine will respond to addition of acid is to measure it yourself on the lab bench. This process is very simple as long as you have a well calibrated pH meter (link again), and a micropipette. 

Acid Trial Protocol

 Titratable acidity

Technically, titratable acidity is the sum of all of the free (dissociated) and bound (undissociated) protons in a solution. This measurement correlates to the total amount of acid molecules in wine including all of the tartaric, malic, citric, lactic, acetic and succinic acids as well as which form they are in (6,7). The TA of a juice or wine can give you a good indication of the sensory perception of acidity. Though there is a little bit of initial set-up, TA can also be measured easily in the winery lab with a well calibrated pH meter, a burette and a stir plate. 

Titratable Acidity Protocol

Sending out samples to service labs

If you want to verify your in-house readings, or if you want additional tests such as malic acid and YAN, you may consider sending samples for analysis at a service lab. Be sure to follow any instructions given by that lab in terms of sample size, hours/days of delivery, and sample preparation. Without intervention (use of preservative, freezing or boiling), grape juice samples will likely begin fermentation during shipping, altering several chemical parameters. Due to potential of tartrate precipitation, juice and wine samples that have been frozen may have some alteration of pH and TA (malic acid and YAN will remain the same with freezing). To determine the best method of shipping for your samples and desired analysis, it is recommended to contact the lab and ask before sending samples. Lab personnel are generally very friendly and informative and can be a huge help when determining the best course of action.


High pH and Acid Adjustments

Some vintages bring higher than normal pH values, even at lower brix levels. Following is a brief review of the concepts of acid and pH which may help inform winemaking decisions regarding acidity and acid adjustments.


Figure 1: Structure of Tartaric Acid

The predominant acids in juice that contribute to acidity are tartaric acid and malic acid. There are others present in smaller amounts, such as citric acid, that can contribute to the flavor profile later, but, the effect on acidity is mainly due to tartaric and malic. Acids are defined as molecules that will will dissociate a proton in aqueous solution.  “Strong” acids fully dissociate, so that all acid molecules have given up a proton, while “weak” acids are in an equilibrium where some molecules have dissociated and others have not. Both tartaric and malic acids are weak acids.


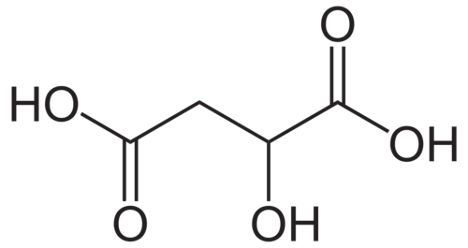
Figure 2: Structure of Malic Acid

In the wine lab, two measurements are routinely taken to assess the acidity of the juice or wine: pH and TA. TA is a measure of how many protons have been given up when titrated with base up to pH = 8.2. Tartaric acid will give up two protons at this pH and malic acid will give up one. The TA contributes to the acid flavor of the wine, and different acids have different effects on the sensory characteristics (malic acid vs. lactic acid).  Generally TA of finished wine ranges from 5.5 - 8.5 g/L. 

pH is a measure of the hydrogen ions currently in solution. It is sometimes referred to as acid strength. The pH scale is both inverse (a solution at pH = 3.0 has more hydrogen ions than a solution at pH = 4.0) and logarithmic (there are 10 times more hydrogen ions at pH = 3.0 than at pH = 4.0). Generally, white wines fall in a pH range of 3.1 - 3.4 and red wines fall in a range of 3.4 to 3.8. 

The pH of a wine is important because it affects the microbial stability of the wine, the efficacy of SO2, and the color of red wine. Some spoilage microbes are inhibited by lower pH (Brettanomyces is less active at pH<3.8, though this does not fully prohibit Brett infection).  A larger proportion of SO2 is in its molecular (anti-microbial) form at lower pH.  For example, to achieve a molecular SO2 of 0.8 mg/L, one would need 40 ppm free SO2 at a pH of 3.5, but 79 ppm at a pH of 3.8. Low pH also shifts the equilibrium of anthocyanin molecules from the colorless state to a red pigment (10% are colored at pH = 4 while 20-25% are colored at pH = 3.4-3.6).

Though tartaric acid and malic acid contribute protons to solution, thus lowering pH, the relationship between TA and pH is not linear because of several factors. Cells of living organisms must remain within limited pH range to sustain all the reactions needed for life, so they contain molecules that will buffer acid/base changes. These molecules will take up or give up protons based on the current situation. This means that not all acid added to the solution directly contributes to pH. It depends on the buffering capacity. Buffering capacity can be different depending on growing conditions, grape cultivar, and overall health of the grapes. 

A general rule of thumb is that 1 g/L of added tartaric acid will lower pH by 0.1.  However, the best way to determine the effect of acid addition in your juice is to do a bench trial with sequential additions of concentrated tartaric acid and record the change in pH. If you would like a written protocol for this, please contact me directly.

Role of potassium

One of the most common questions so far this year is whether or not a wine will hold onto acid once it is added. This has a lot to do with the possum level in the juice/wine. Potassium comes up through the roots of the plant and is actively transported into the grape berry in exchange for protons. Potassium uptake is increased by shading in the berry, and by warmer temperatures.  Since it is carried by water as it comes into the plant, rainy seasons lead to more potassium in the grapes. Since potassium enters the grape in exchange for hydrogen ions, the more potassium there is available to the plant, the lower the proton concentration (and higher pH) in the berry.  This, coupled with warm nights consuming malic acid, is likely a major factor leading to the high pH in grapes this year.

Potassium also plays a role in acid addition to juice and wine. When tartaric acid is added, some of the tartaric acid will bind with potassium to form potassium bitartrate (KHT). When KHT reaches saturation, it will precipitate out of the wine. This process is what is occurring during cold stabilization, essentially removing tartrates before they form in the bottle. When KHT precipitates, it will lower the pH if it occurs below pH = 3.6, but if it occurs above pH = 4.0, it will raise the pH.  (The effect between 3.6 and 4.0 depends on the buffer capacity of the wine.) KHT is more soluble in juice than in wine, so the overall effect of acid addition may change during aging as KHT forms in cold cellars over the winter.  This means that when you do tartaric additions, it is likely some of that tartaric will precipitate out as KHT. However, when that happens, the potassium is taken out of solution and subsequent additions will be more likely to remain in solution. So, you may need to do multiple acid additions, but you should get better retention each time.

Winemaking considerations

What do you do in high pH years? There is no one answer to this question, but here are a few suggestions:
(1) Keep in mind targets that you are comfortable for in terms of stability and aging. It is unlikely you will reach your ideal numbers, so set a reasonable target.

(2) Harvest earlier and chaptalize if the fruit tastes ripe.  

(3) Add tartaric acid at the juice stage to help with microbial selection and color stability. Once anthocyanin bind to tannins, their form (colorless or red) is fixed.

(4) Some yeast strains will consume malic acid during fermentation. Avoid using these strains on wines not meant for malolactic fermentation. (Your manufacturer should be able to tell you if your yeast falls into this category)

(5) Do bench trials of acid additions to determine how much addition is needed to achieve targets. You can also set up taste trials of various additions. Due to buffering capacity, the "norm" of 1 g/L = 0.1 pH point may not hold.

(6) On white wines, think carefully if you want to undergo malolactic fermentation, which will likely shift pH even higher.


References

Zoecklein (2000), Enology Notes #6

Zoecklein et al (1995) Wine Analysis and Production, p 76-83

Boulton et al (1997), Principles and Practices of Winemaking, p 233, 258, 449-451, 534 


Contact

Sign up for our Mailing List